
Wick-Out Trading Journal
Welcome to Wick-Out Journal
Track your trades, analyze performance, and enhance your strategy—all in one place.
Join our community of successful traders today.
Login Start Free JournalingWhere Discipline Becomes Your Edge
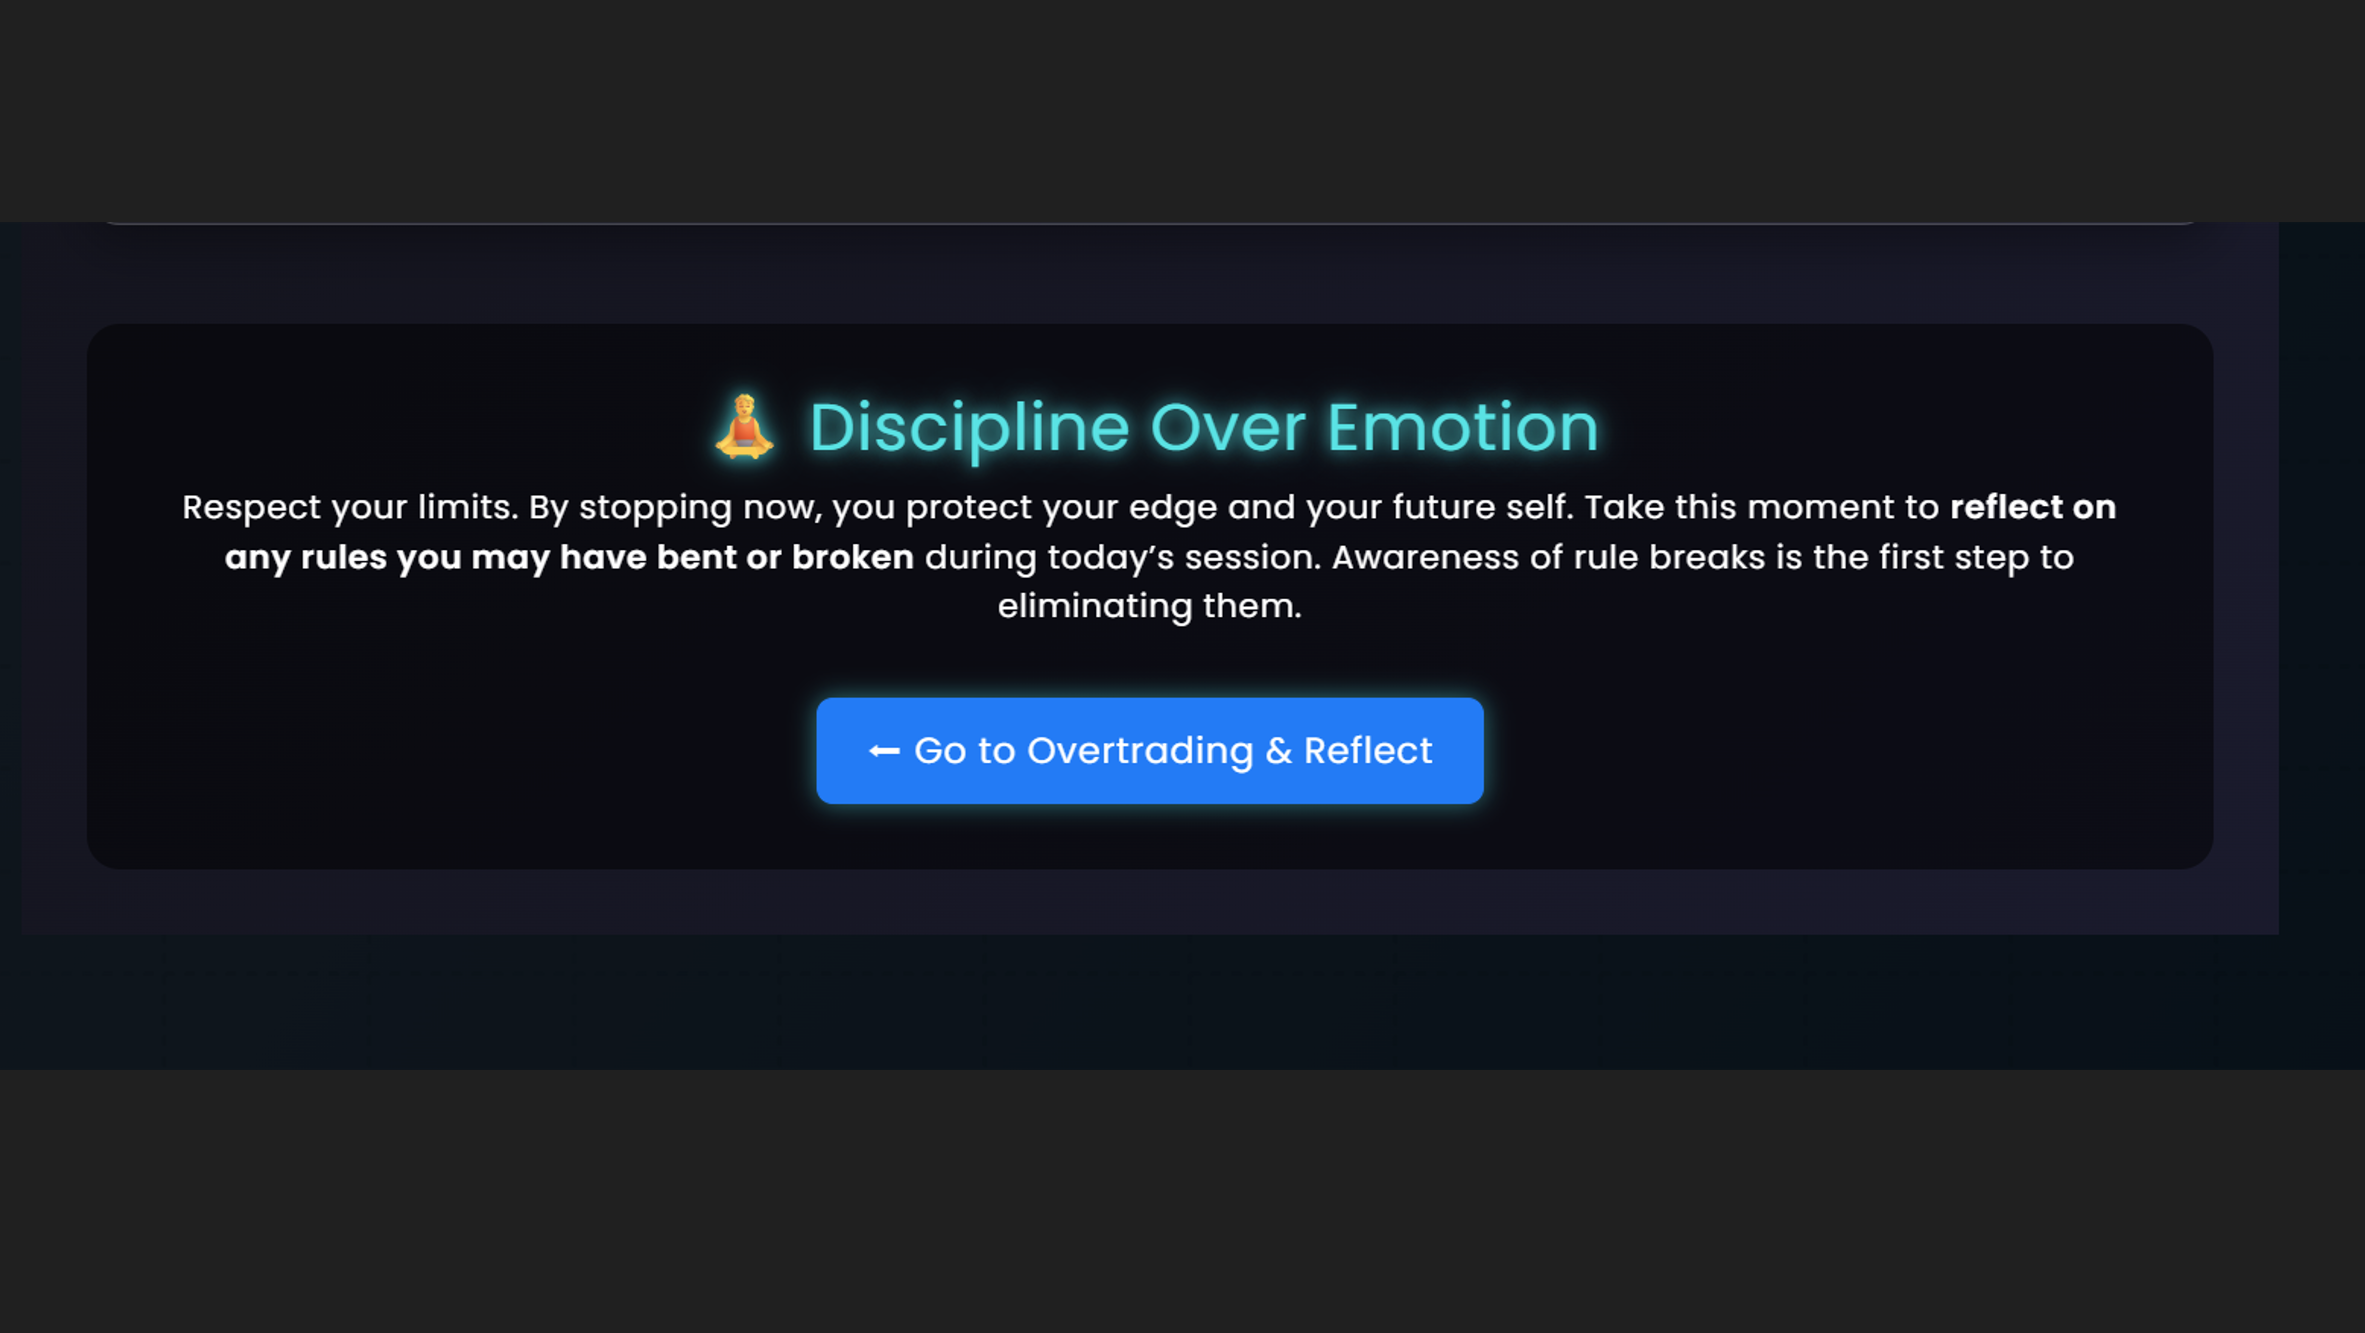
Build Discipline
Wick-Out Journal focuses on discipline, we built pages with discipline cycles that help you cool down after a loss and step away from the charts, avoid overtrading, and focus on taking higher‑quality trades with intention.
Reactive Charts
Our charts don’t just display data — they react to it. When your metrics slip, Wick‑Out triggers alerts and redirects you to educational pages tailored to your weaknesses.
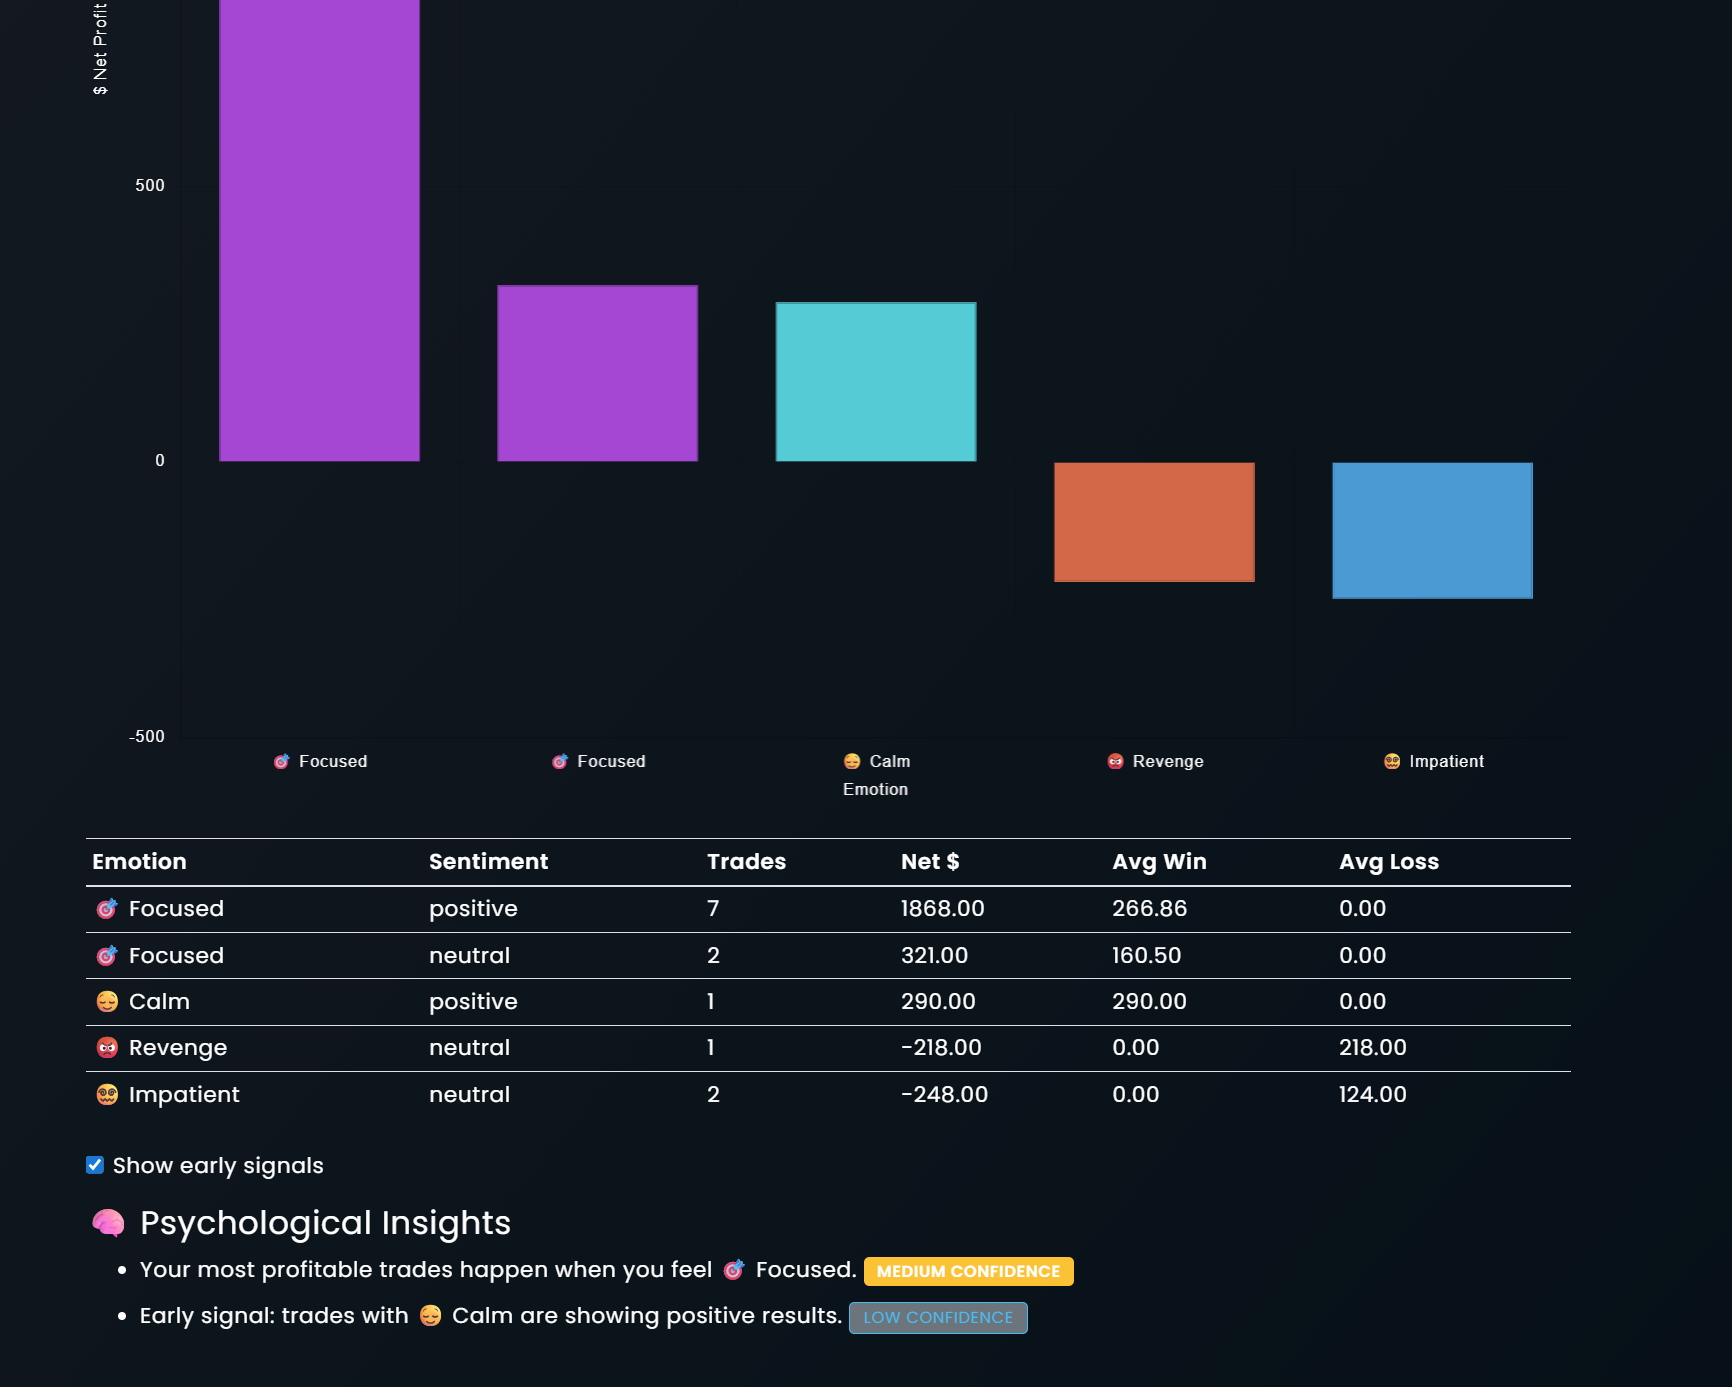
Psychology Insights
We’re the only journal with dedicated psychology pages built around discipline cycles. Understand your emotional patterns and strengthen the mindset behind consistent trading.
Discipline Makes You Profitable — Not Profit Goals
Most journals push traders to chase weekly monetary targets. Wick‑Out is different. We focus on discipline first, because discipline is what actually produces consistent profits. When you master your behavior, the money follows naturally.
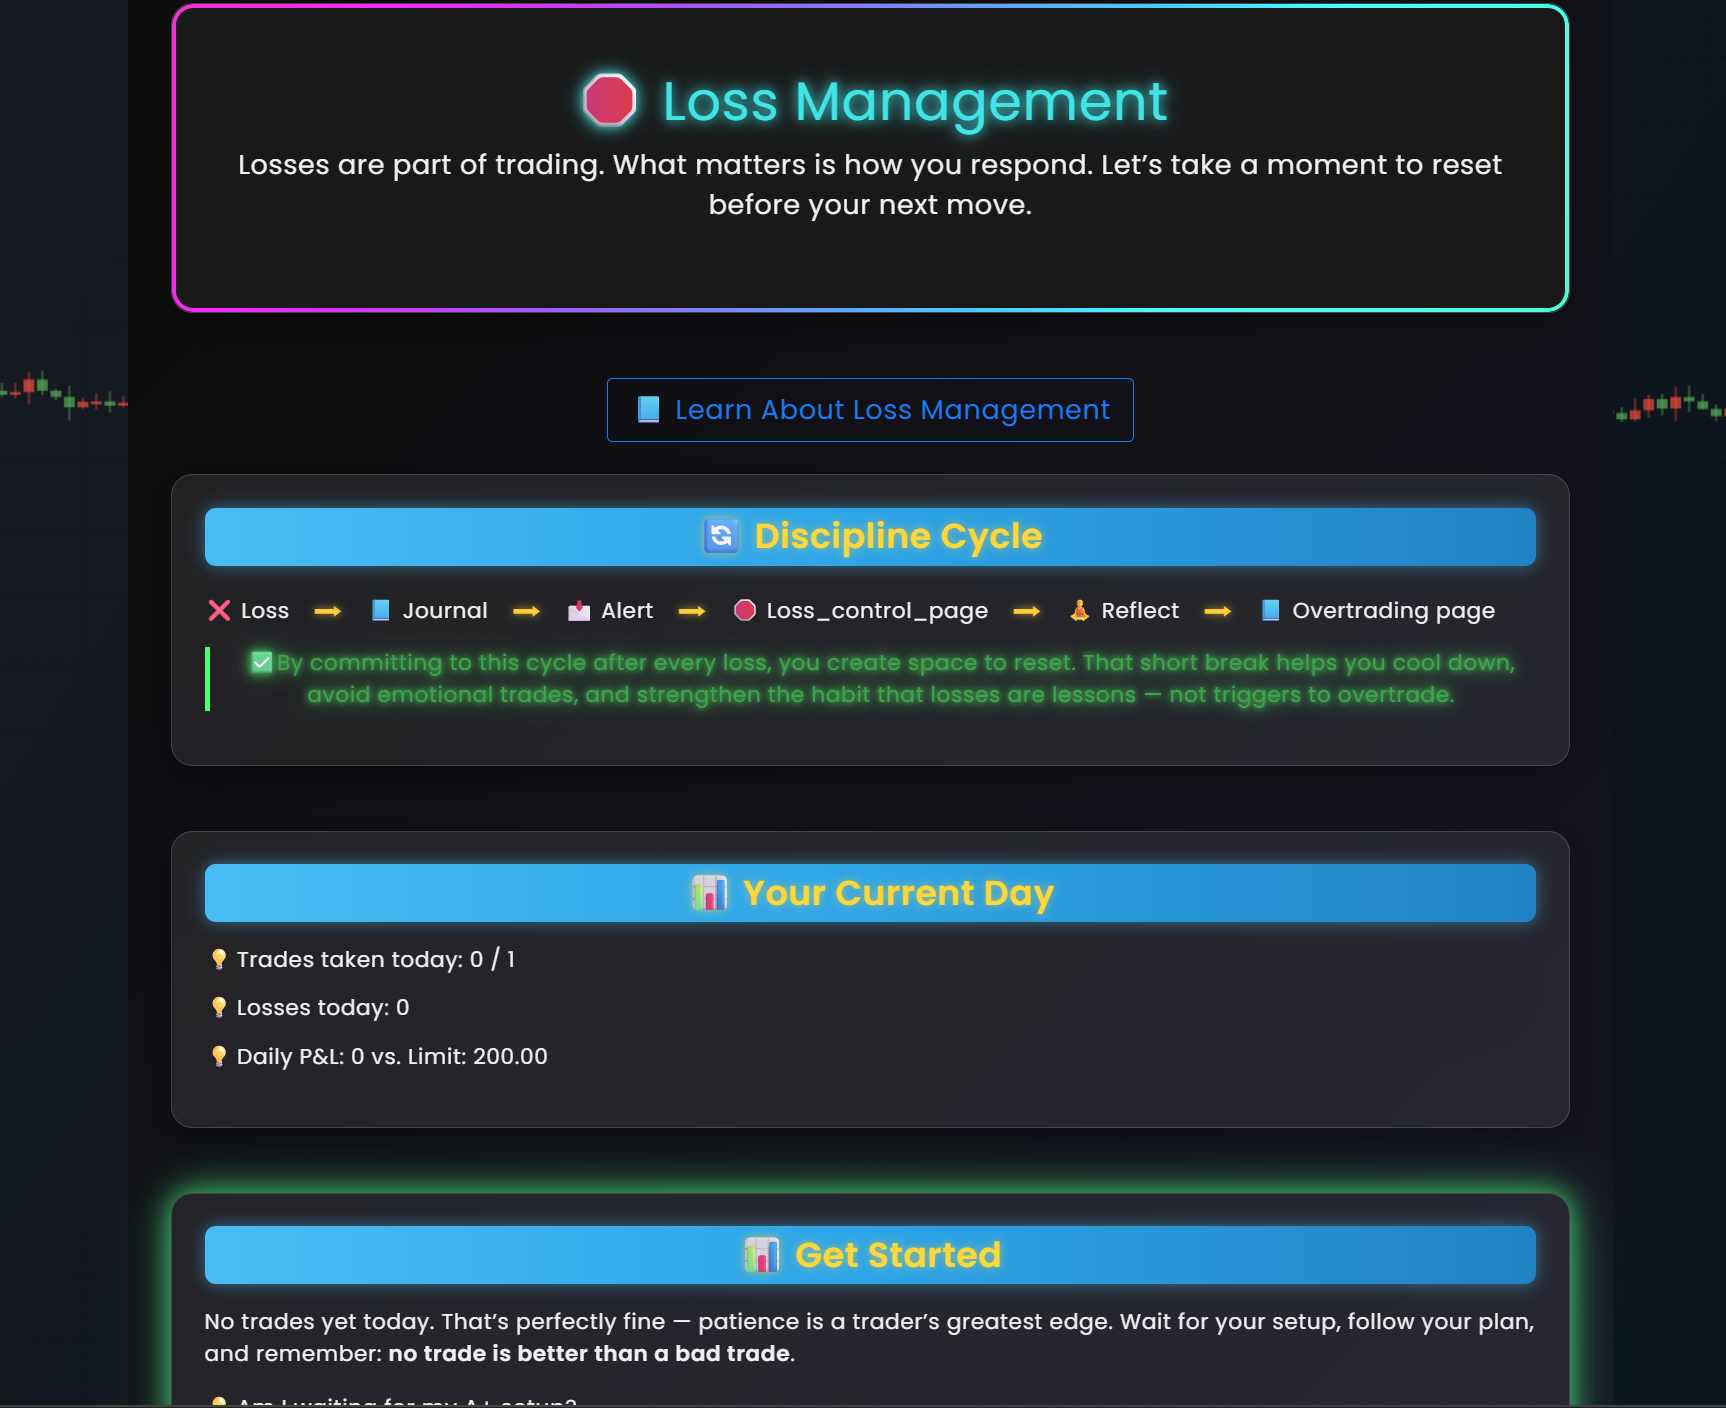
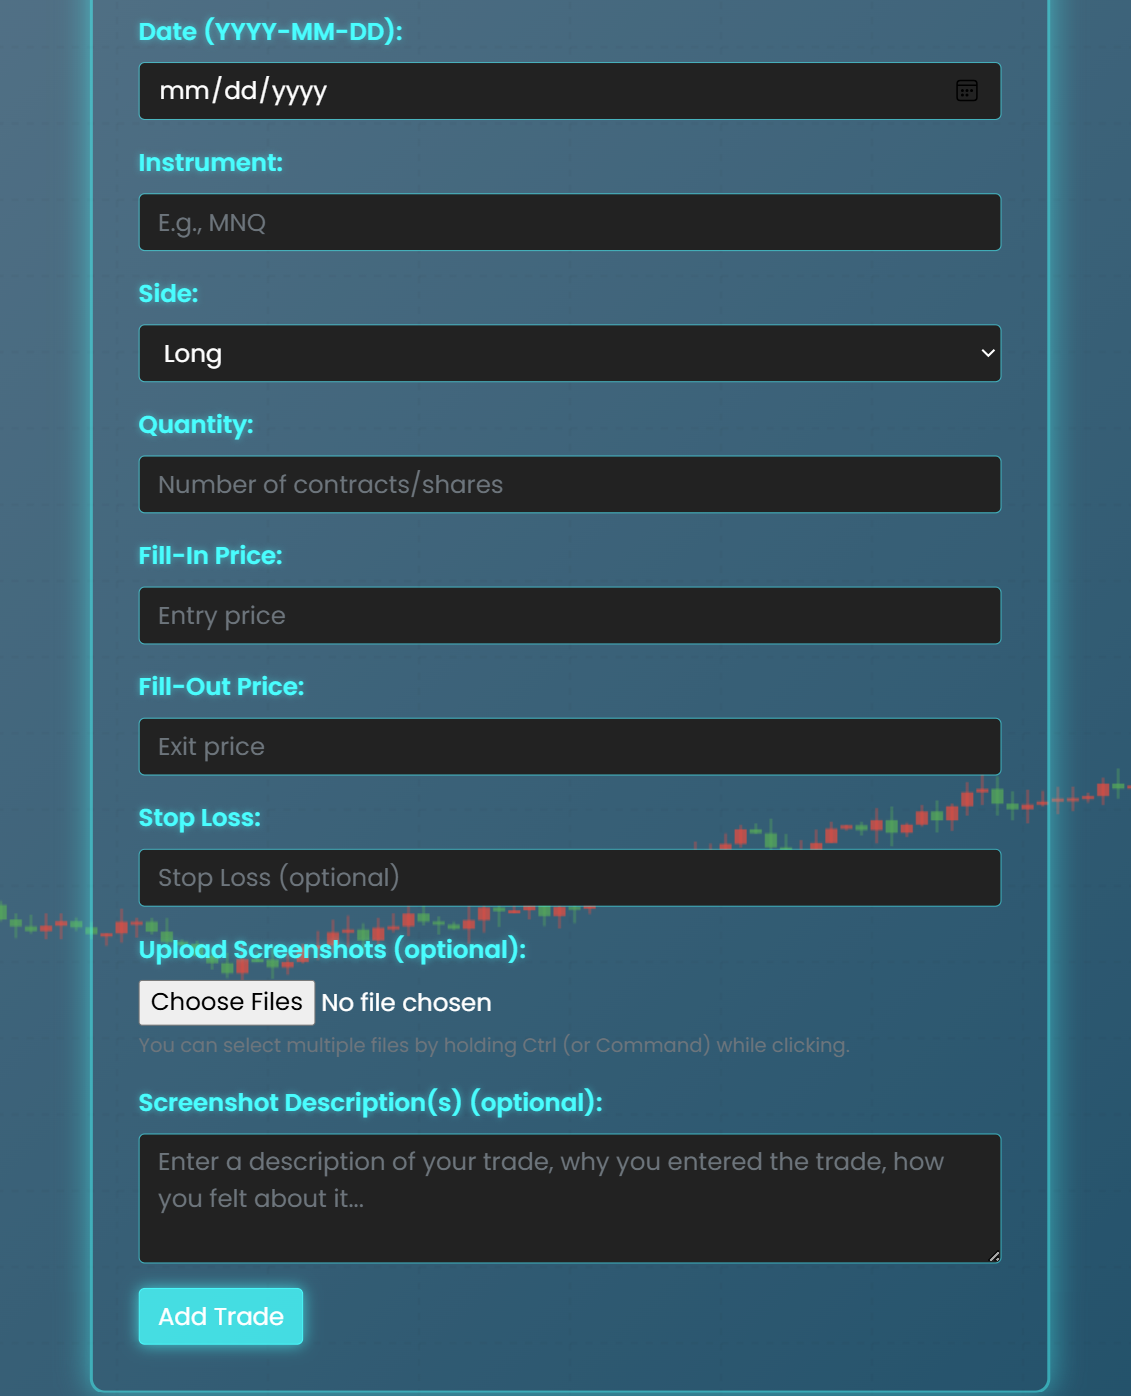
Manual Logging Helps You Cool Down After a Loss
Logging a trade immediately after a loss forces you to pause, breathe, and step away from the charts. This break interrupts emotional spirals and prevents the overtrading that destroys accounts. Manual logging isn’t a limitation — it’s intentional. Wick‑Out could automate everything, but we keep this step manual because discipline is built in the moments when traders slow down and reflect, not when software does the work for them.
The Only Journal With Dedicated Psychology Pages
Wick‑Out goes beyond numbers. Our psychology pages help you identify emotional triggers, behavioral patterns, and discipline cycles. No other journal gives traders a structured way to understand why they make the decisions they make.
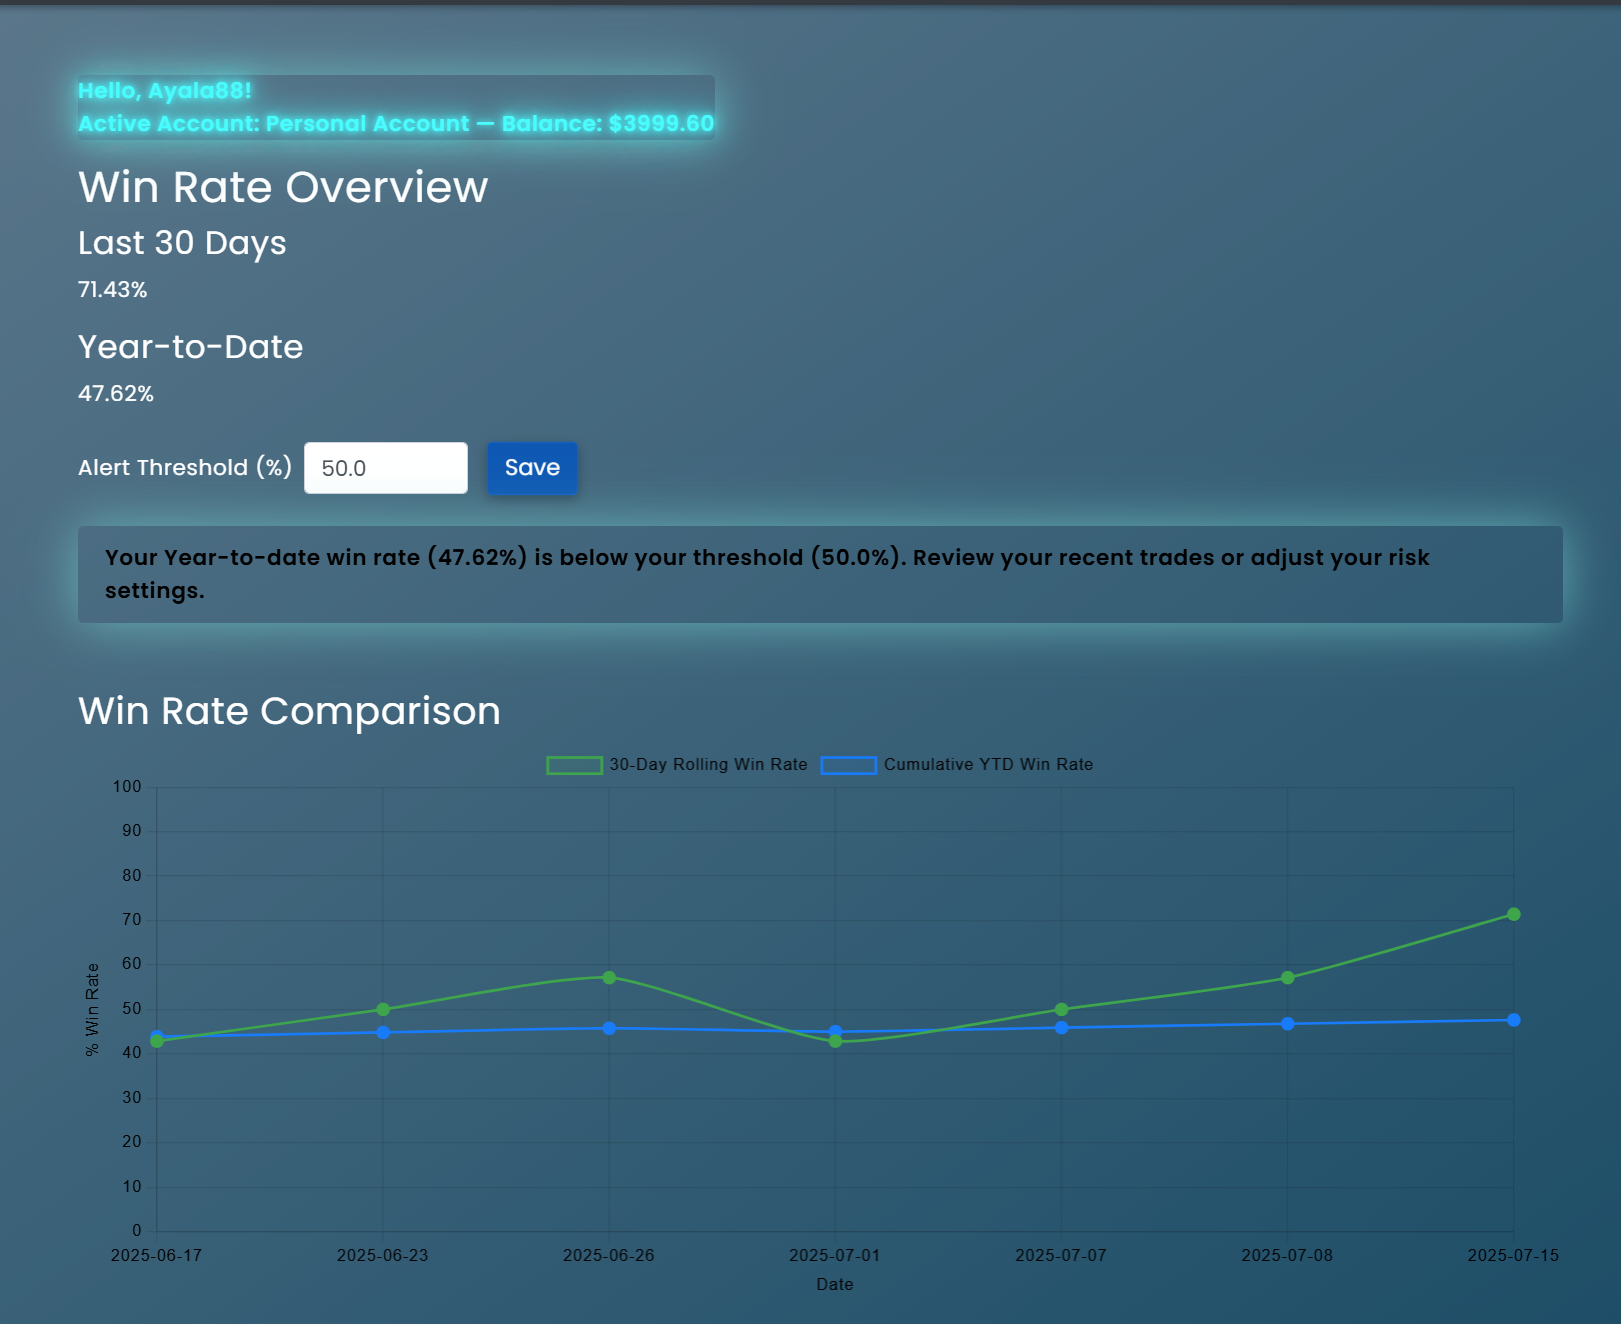
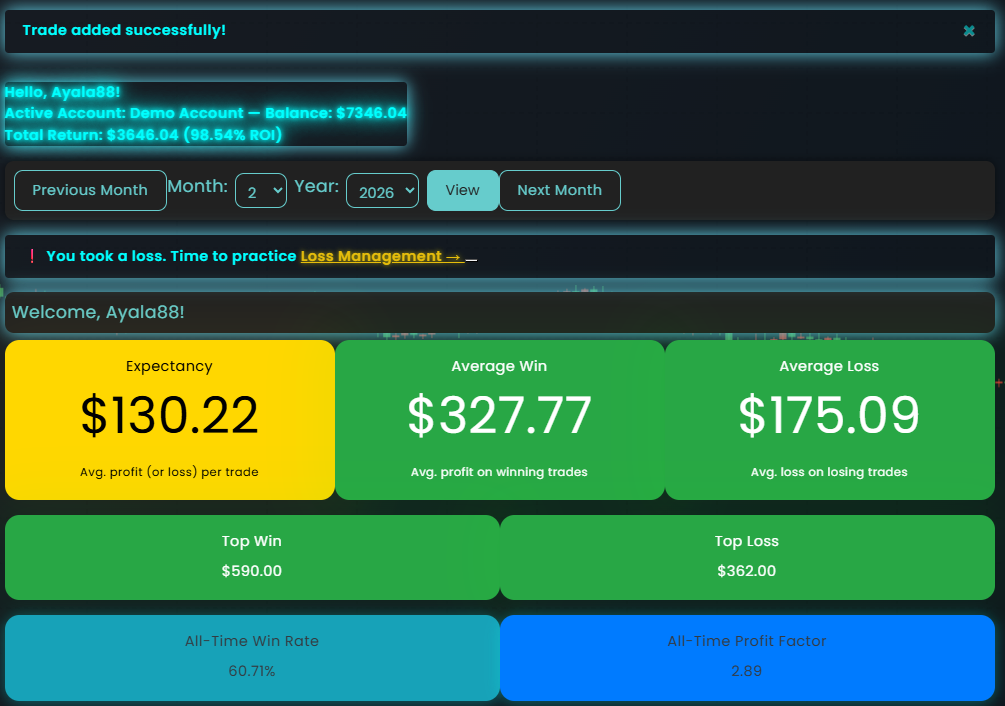
Your Metrics Come Alive
Wick‑Out’s analytics react to your behavior. Cards glow green as discipline improves — or pulse red when it slips.
Alerts Trigger When You Need Them Most
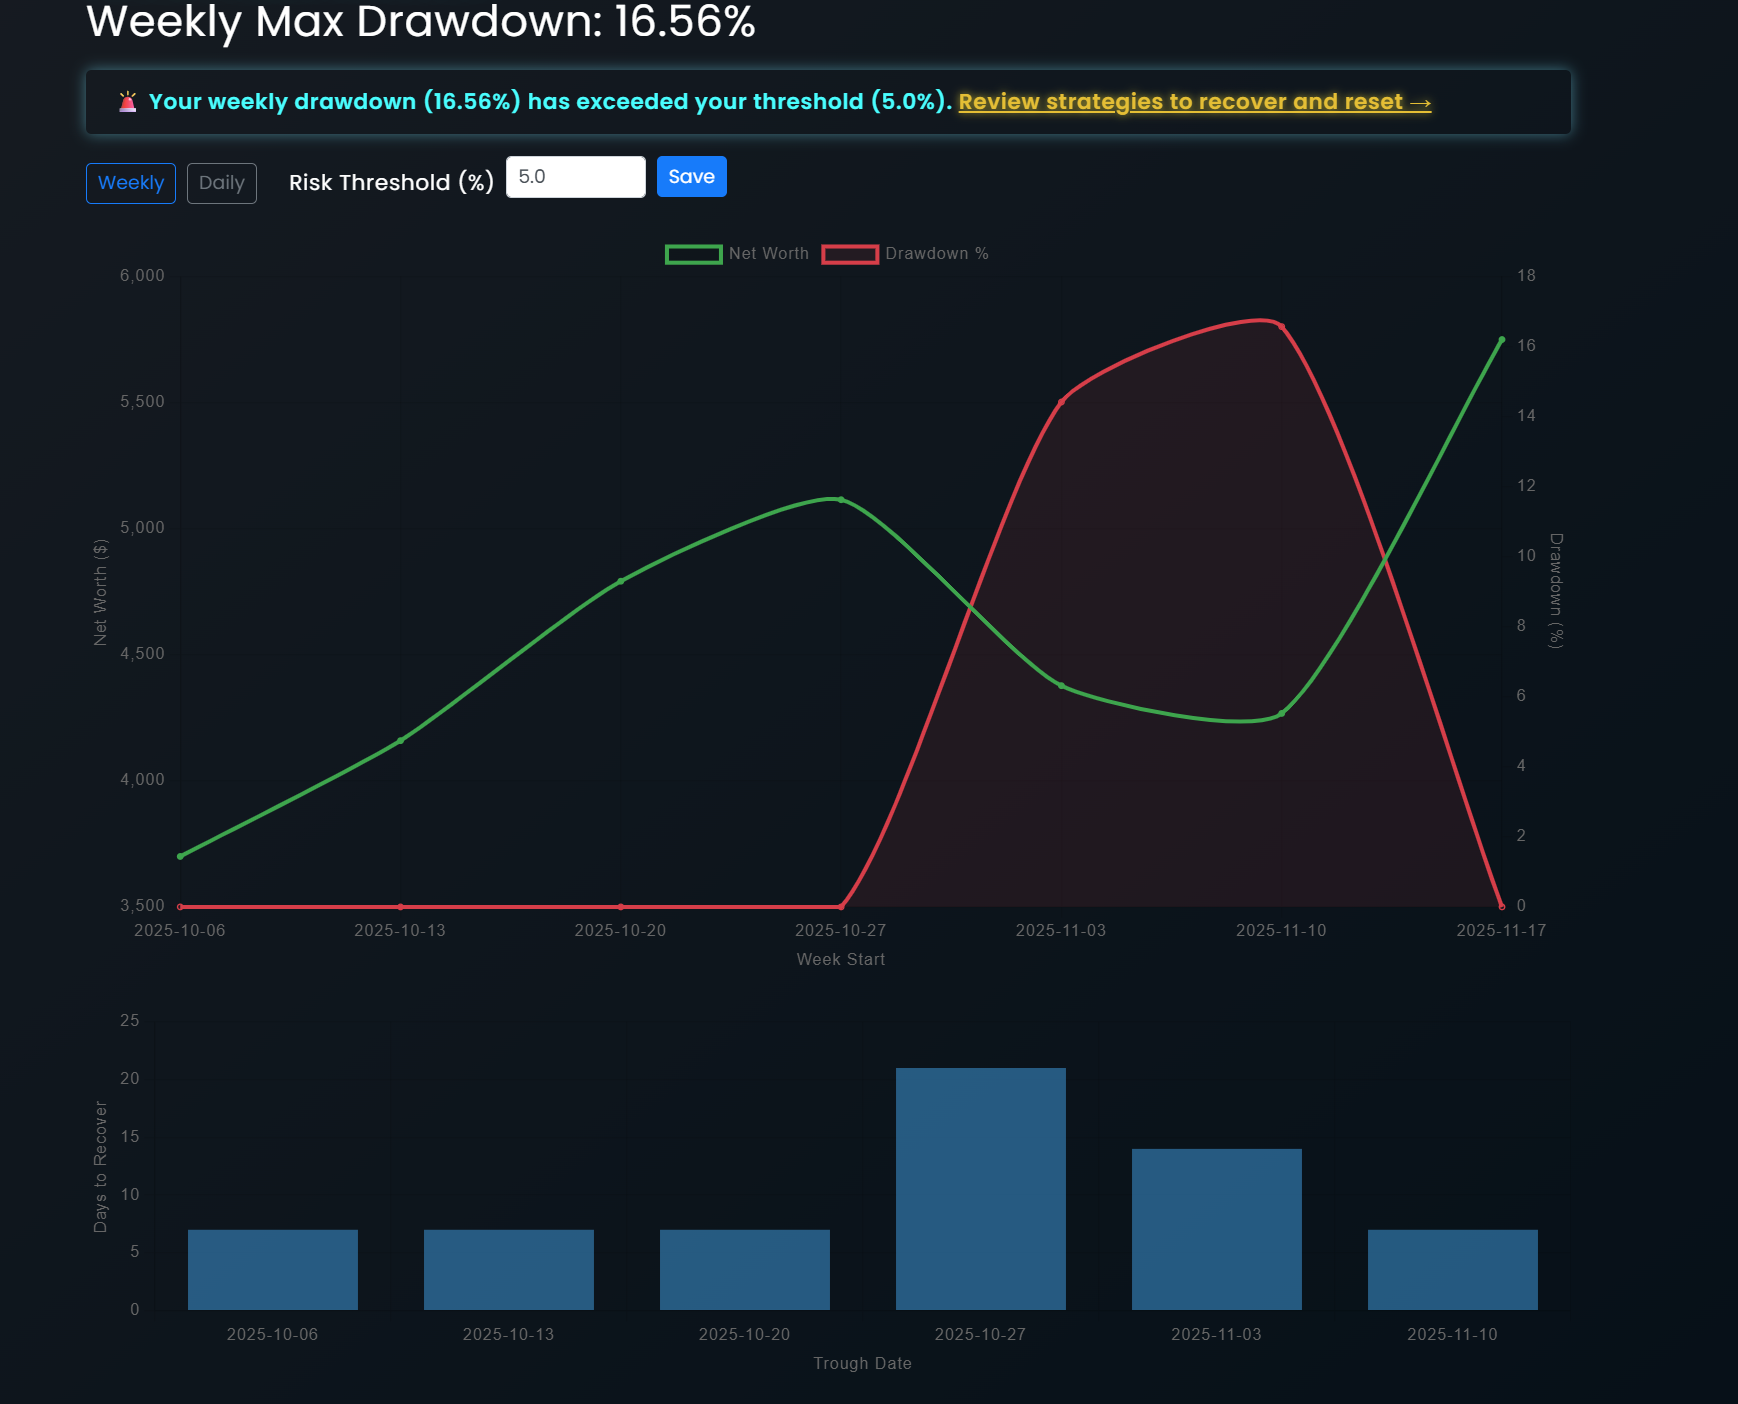
If your win rate, risk‑reward, or drawdown crosses your threshold, Wick‑Out notifies you instantly and redirects you to targeted education.
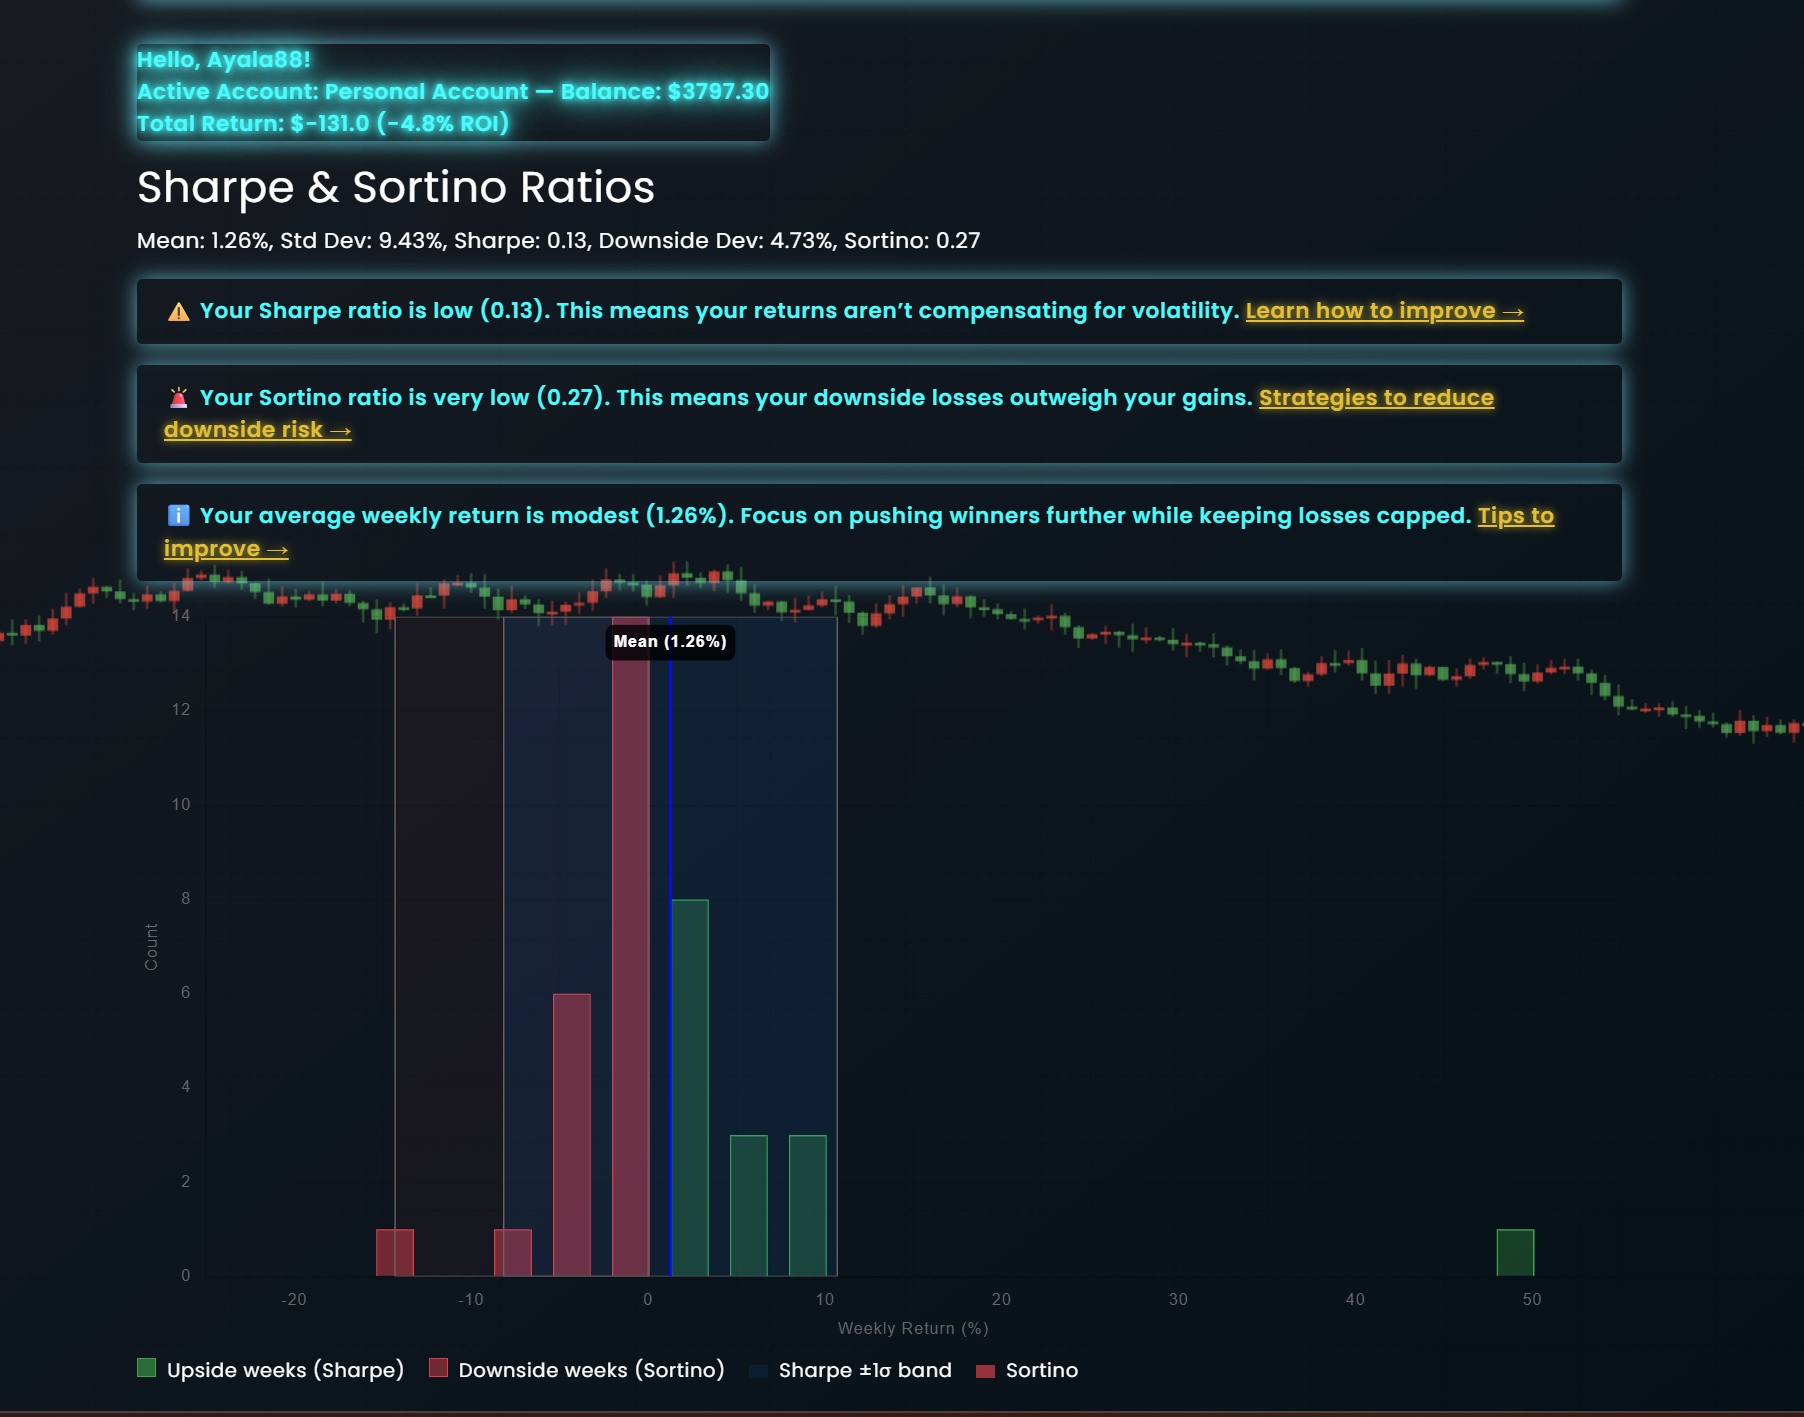
Data That Coaches You
Every metric becomes a feedback loop. You don’t just see your performance — you’re guided to improve it.
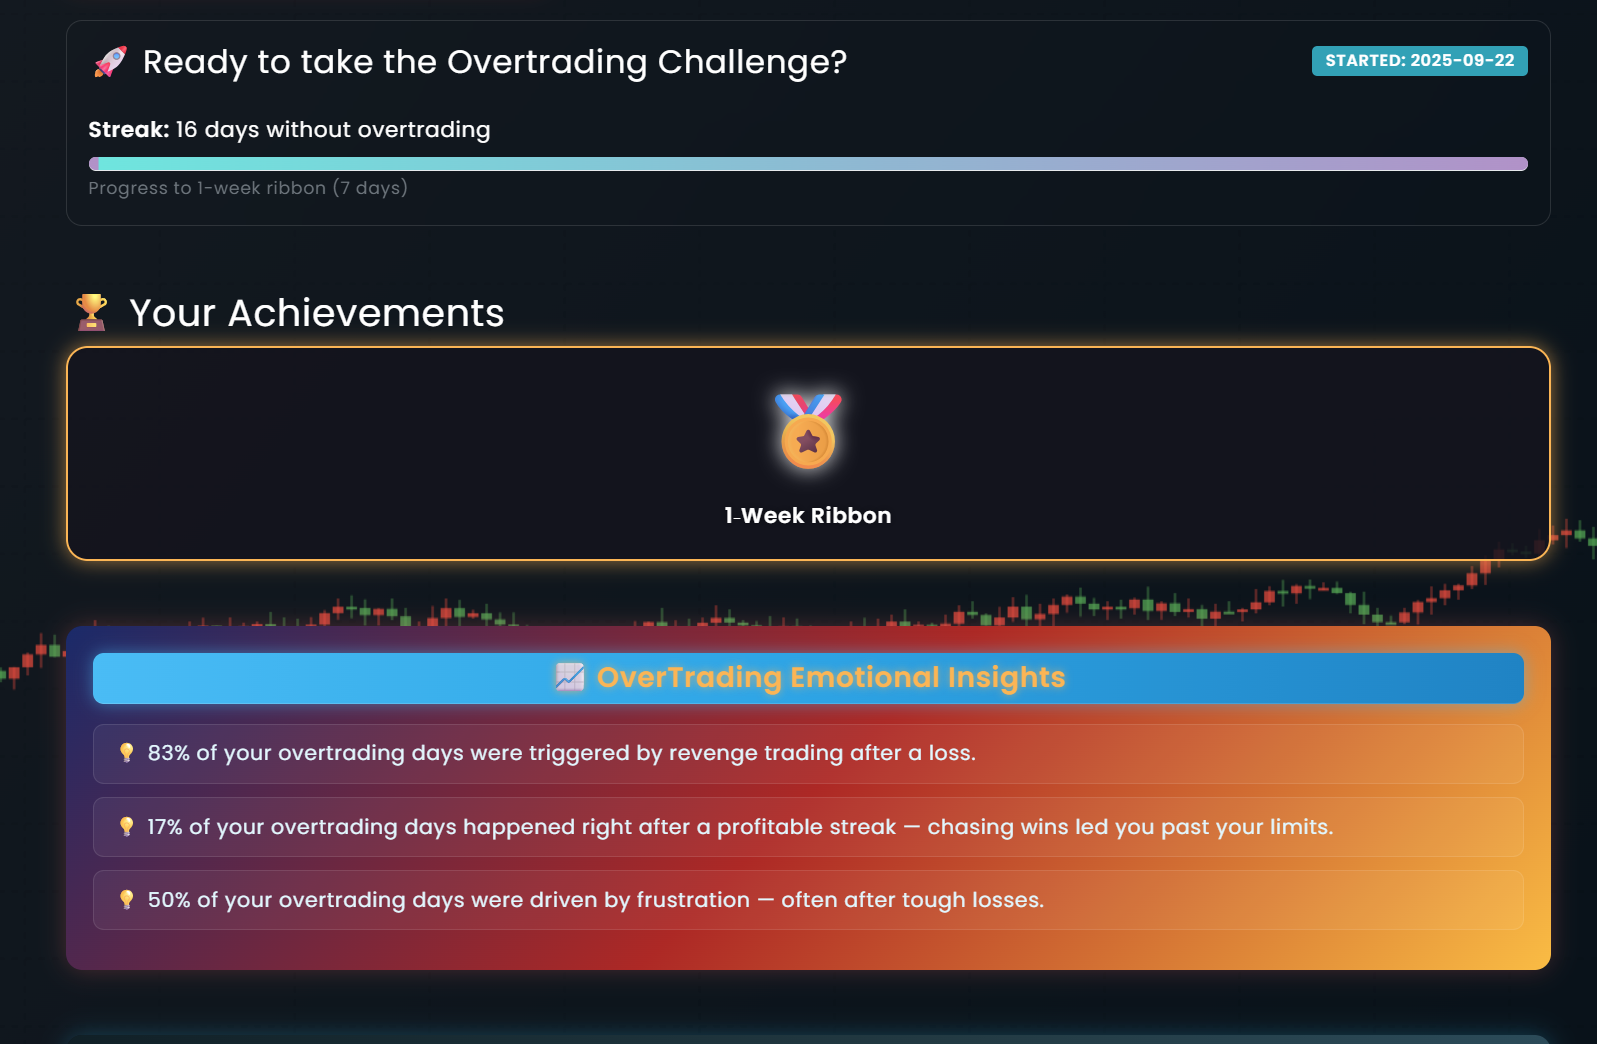
Your Mindset Becomes Part of the System
Wick‑Out tracks more than numbers. It tracks the emotional patterns behind your decisions.
Cycles That Break Bad Habits
Our psychology cycles help you identify triggers, interrupt destructive behaviors, and reinforce discipline.
Consistency Becomes Automatic
Over time, your emotional responses stabilize. You trade with clarity, not impulse.
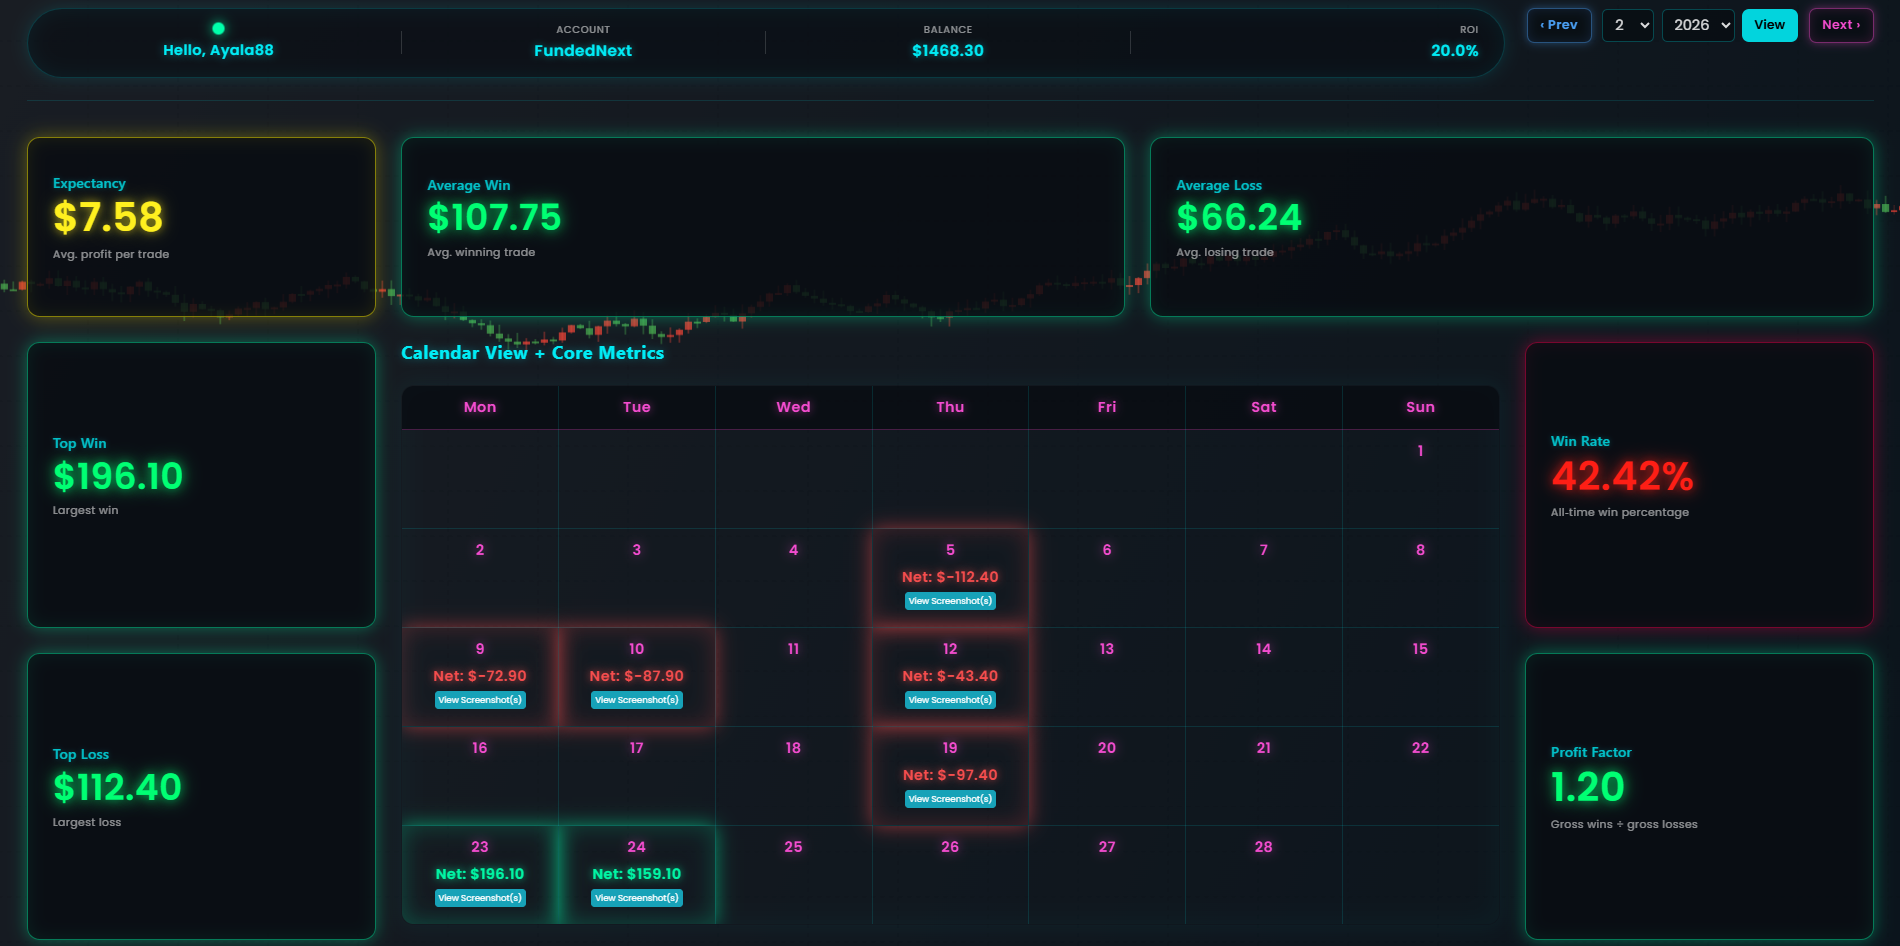
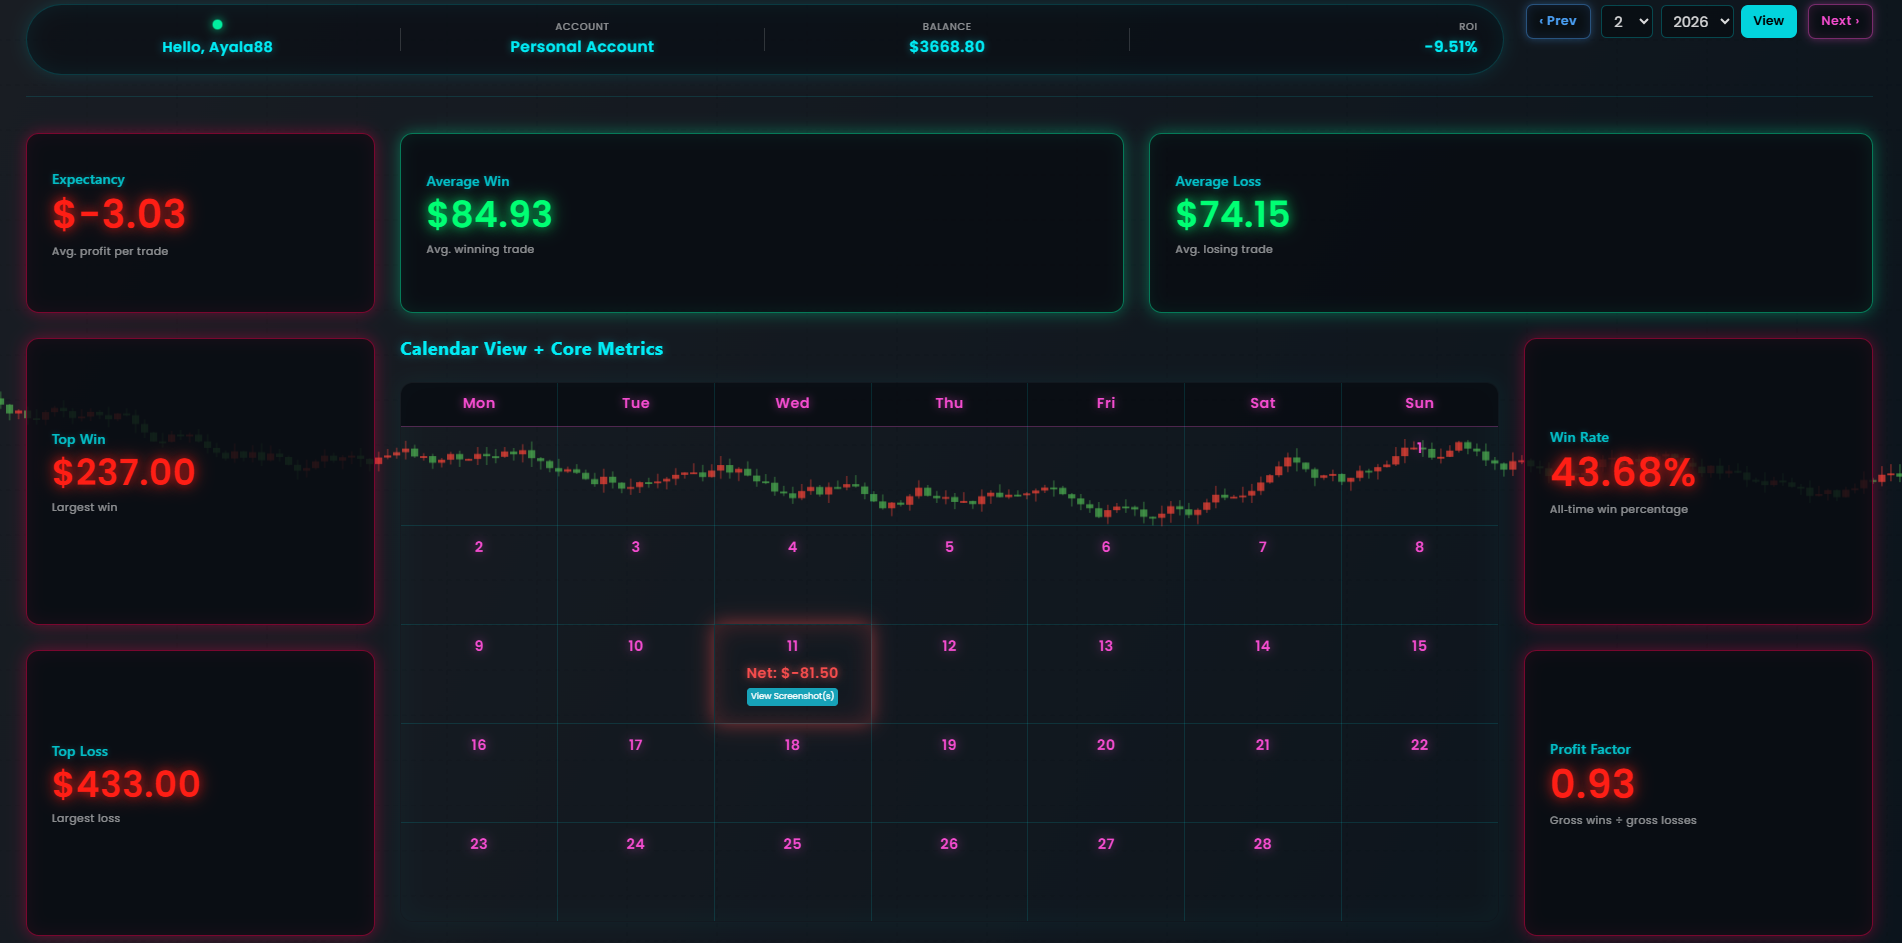
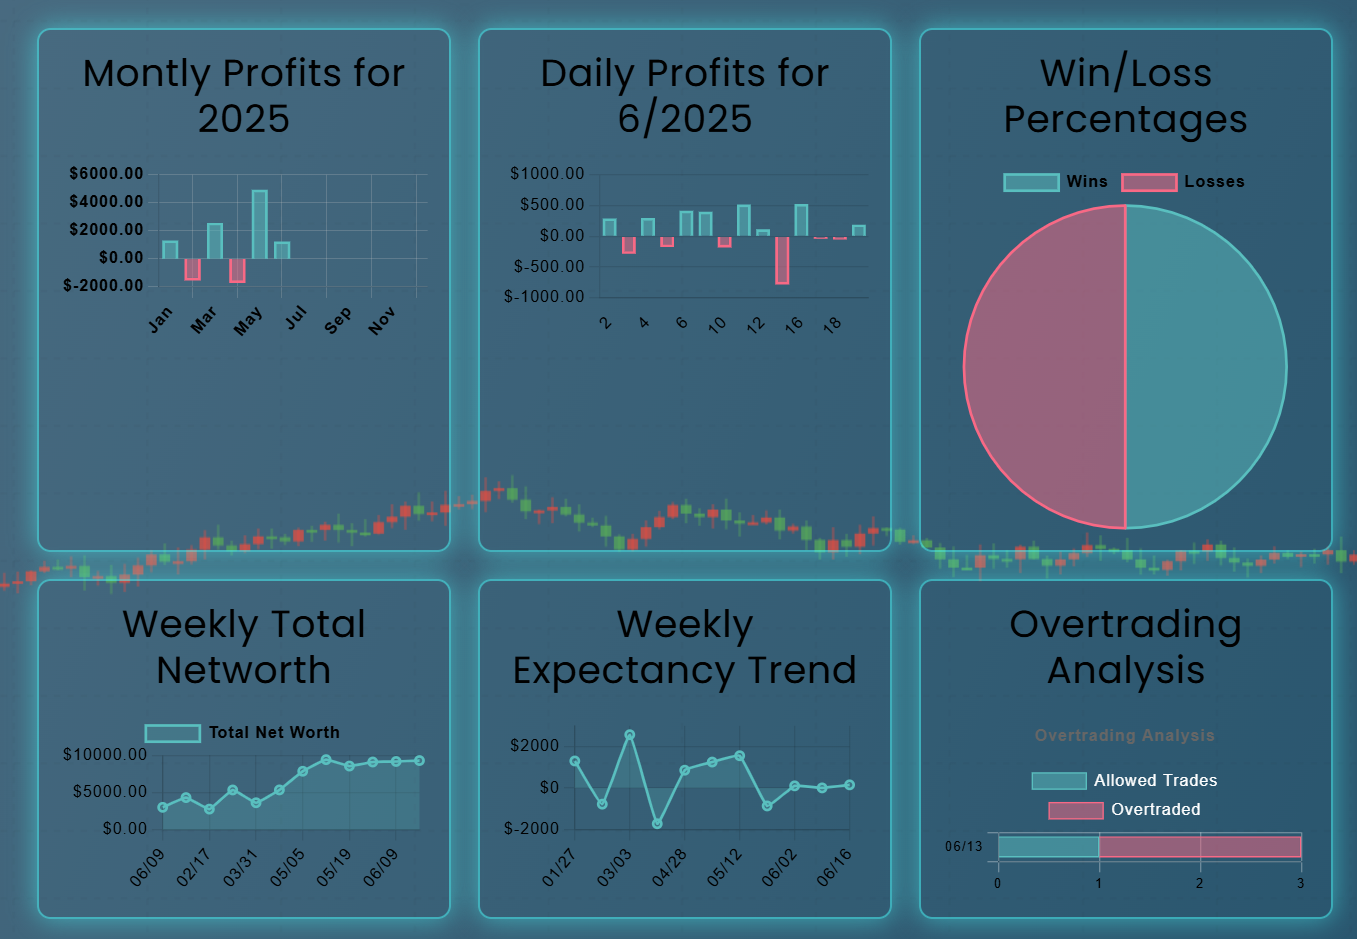
Your Dashboard Reacts to Your Discipline
Wick‑Out’s dashboard isn’t static — it responds to your behavior. When your win rate slips, the card pulses red. When discipline improves, it glows green. Every metric becomes a visual signal that keeps you aware and accountable.
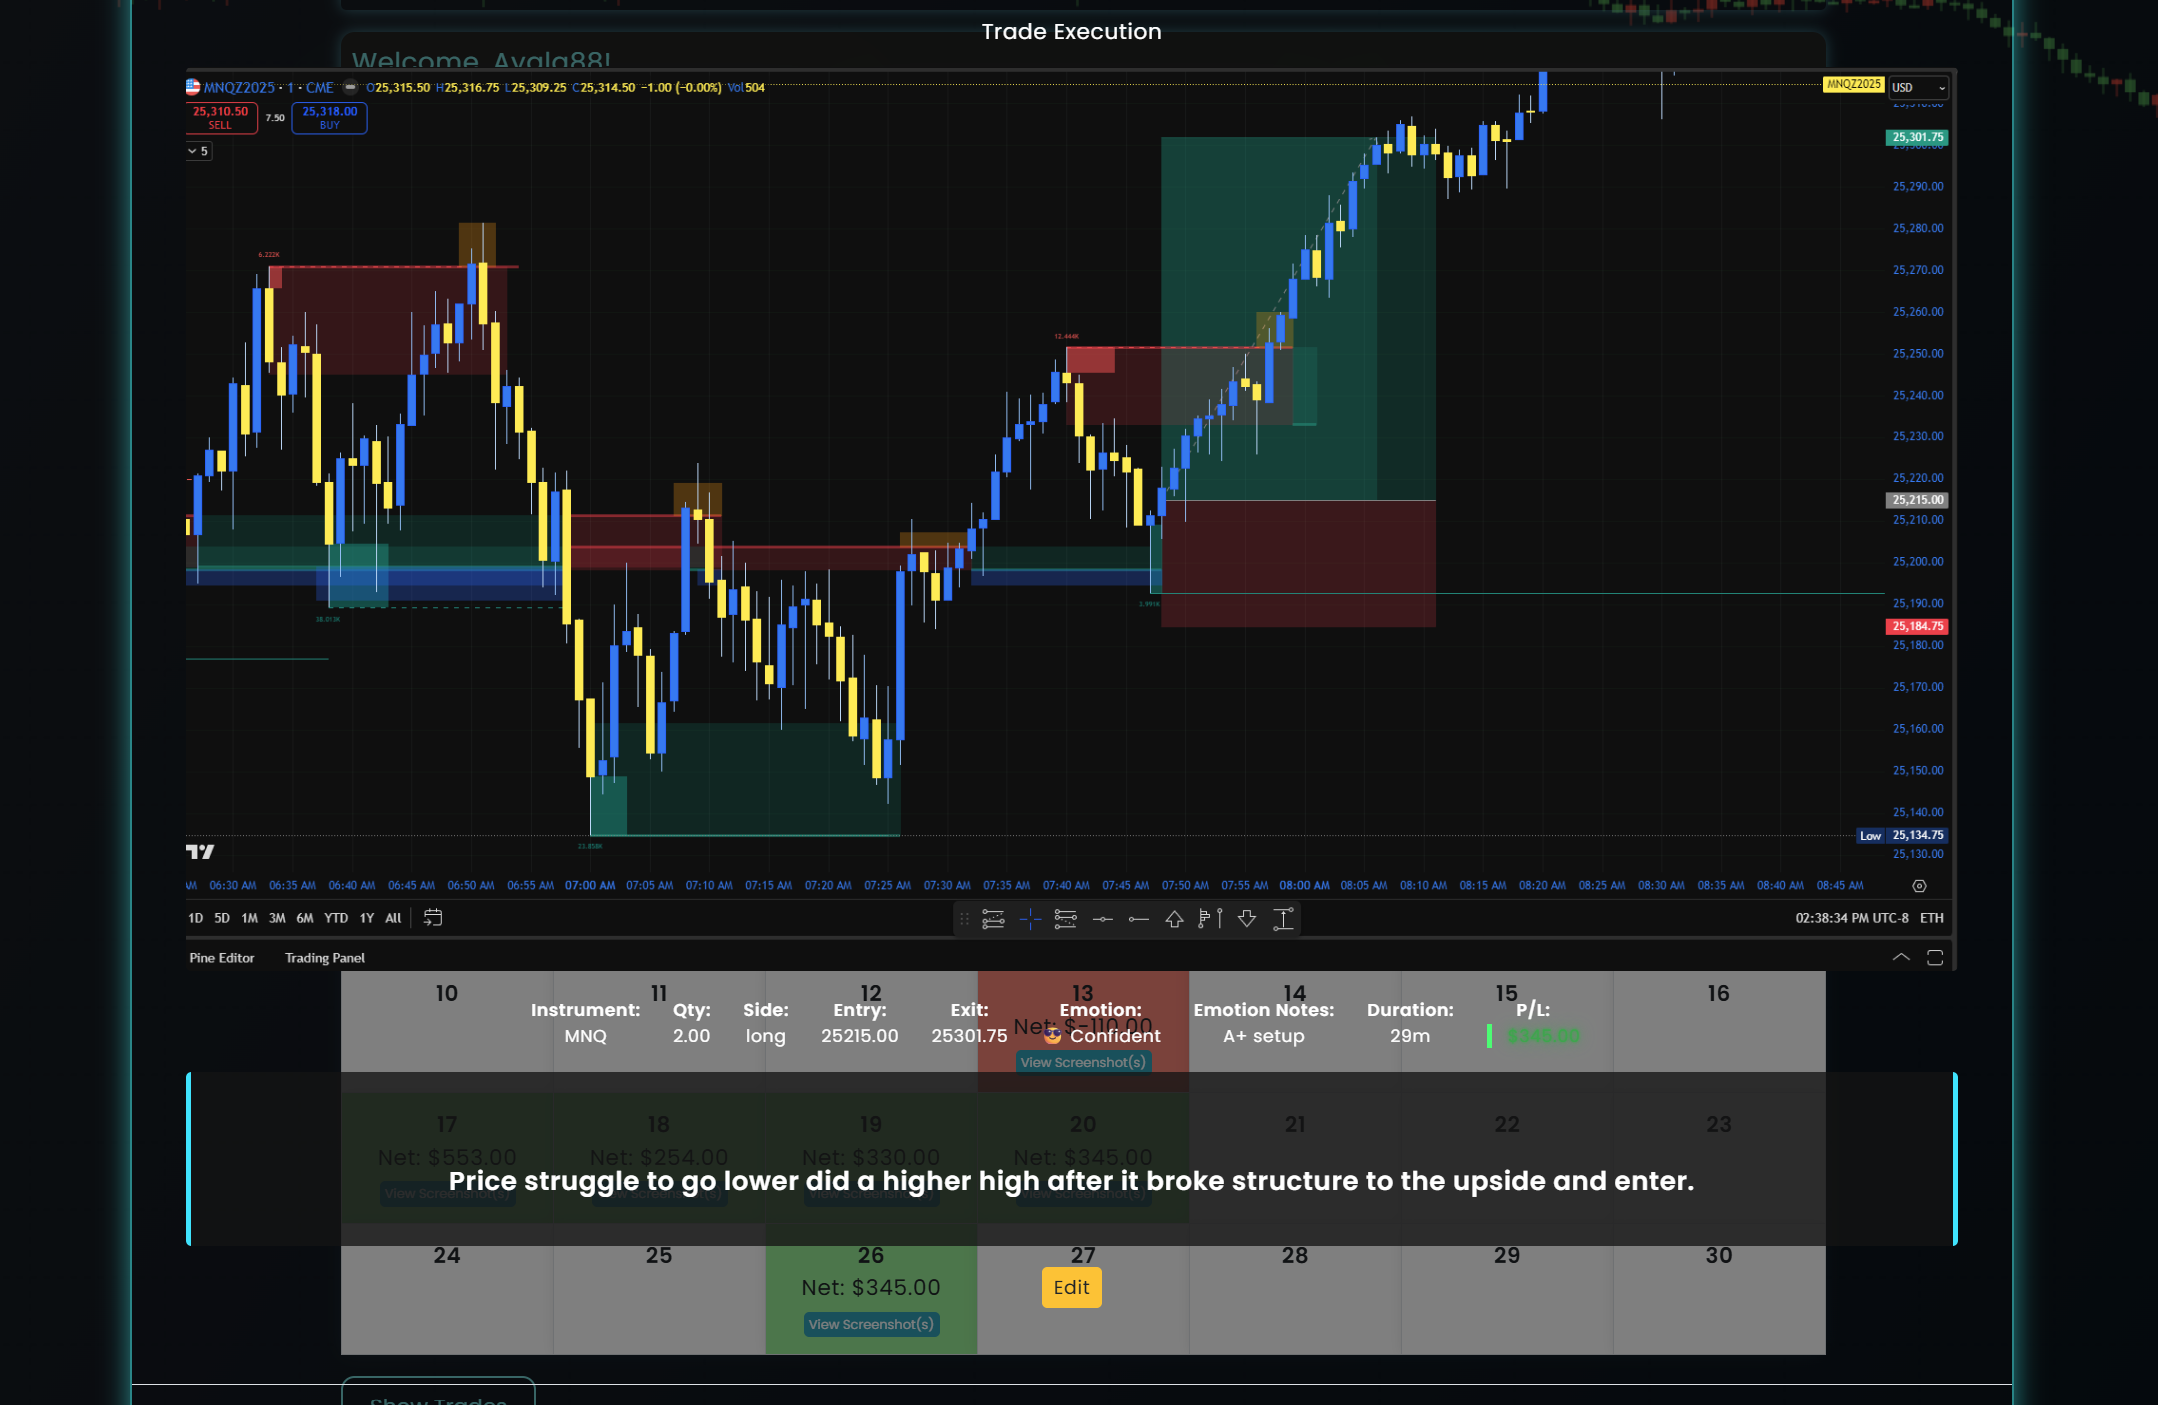
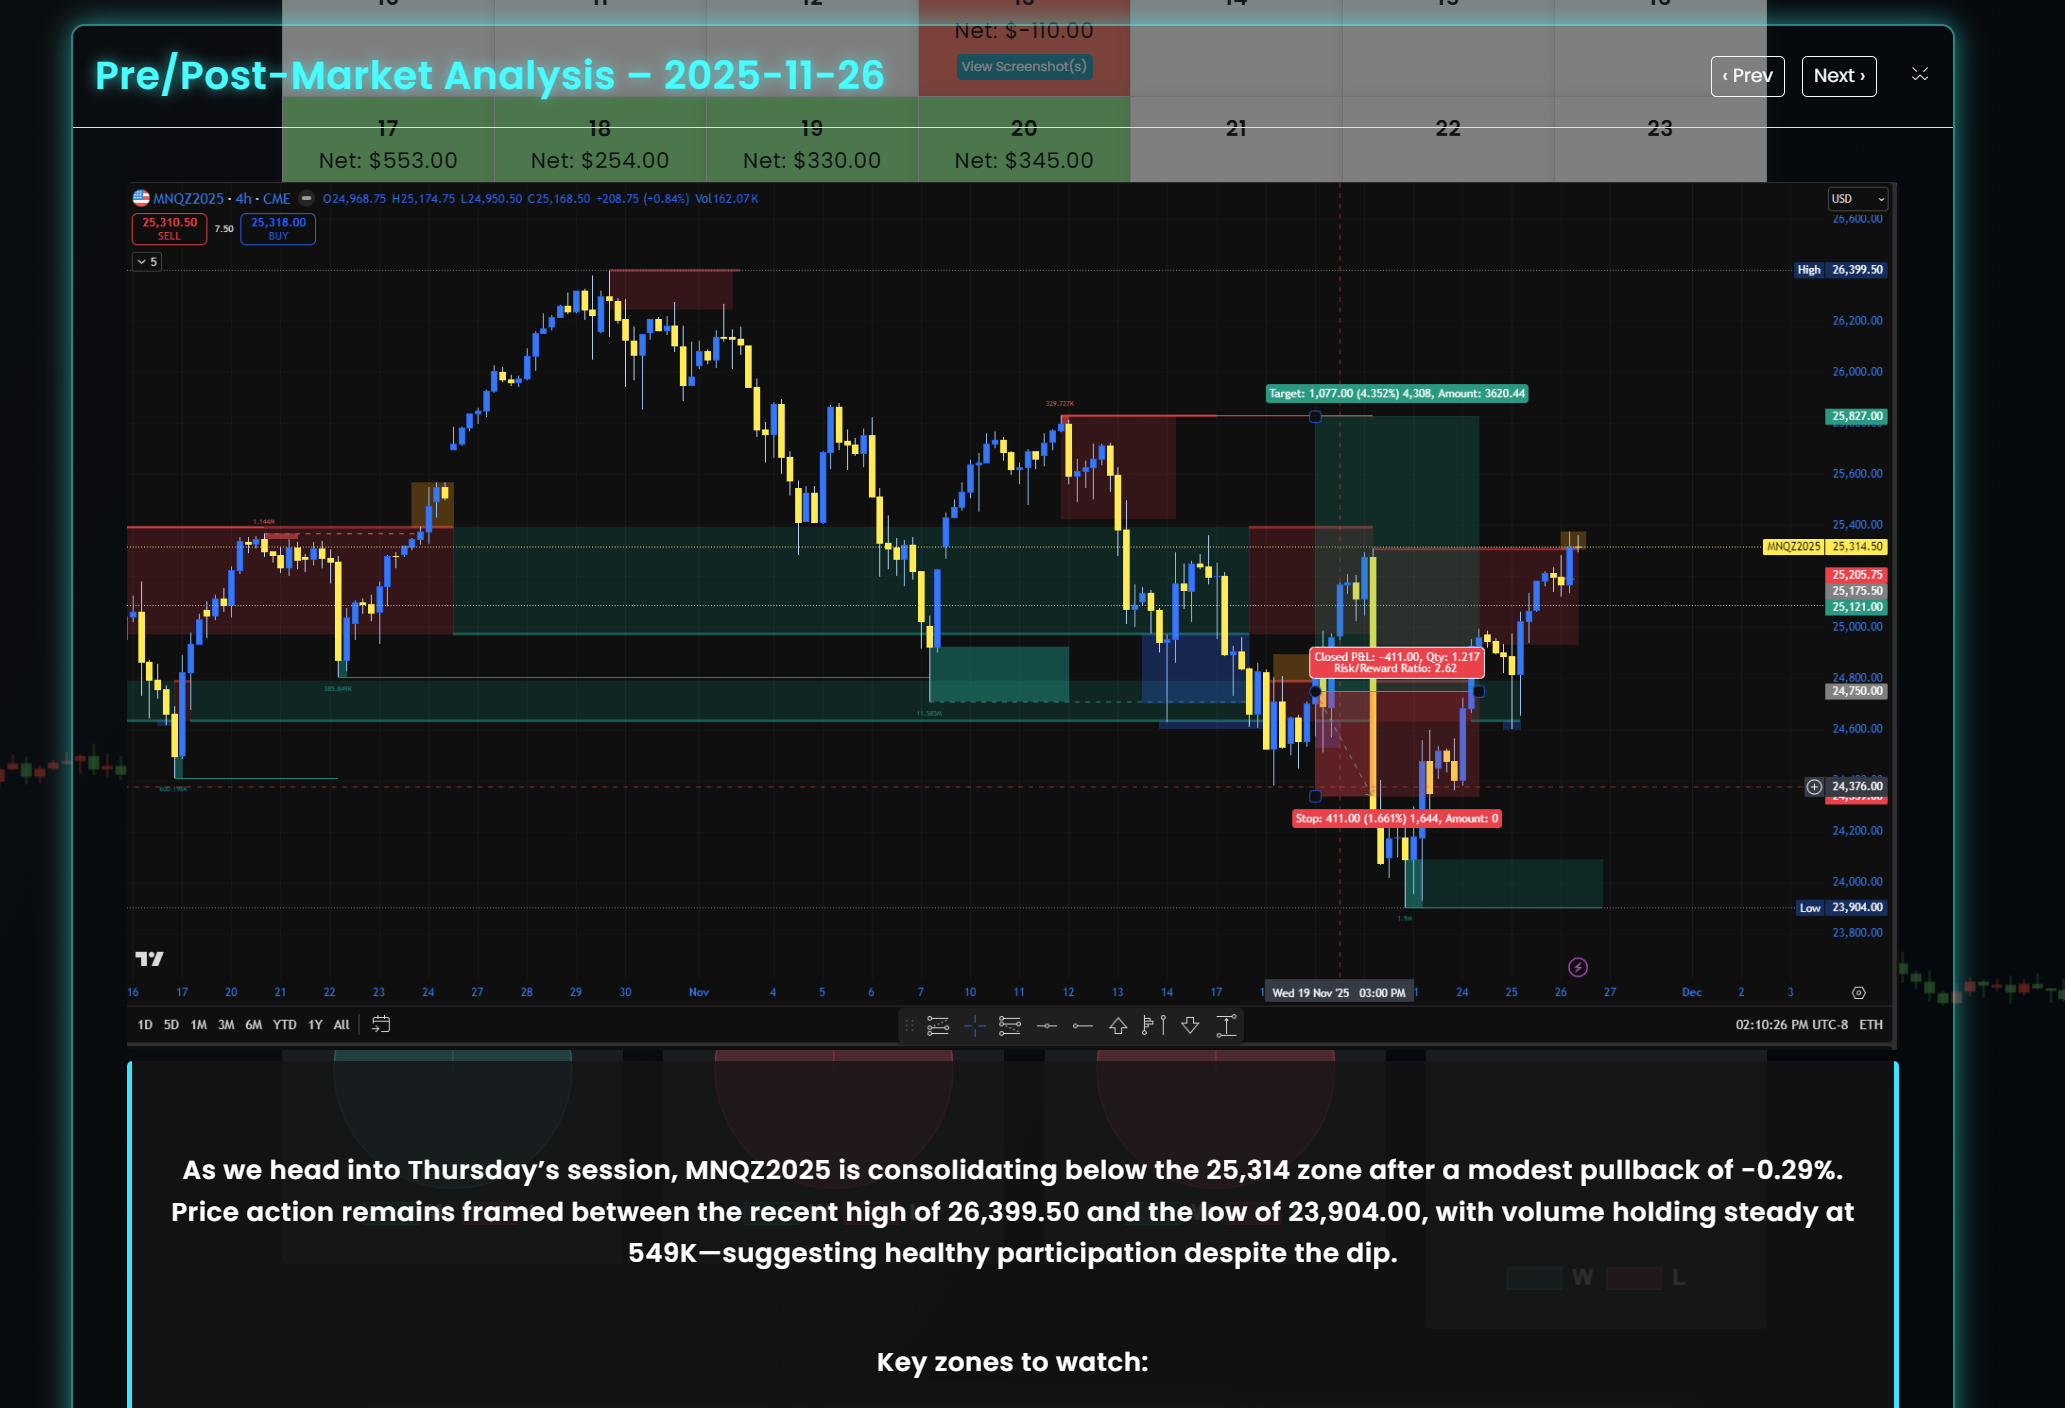
A Calendar That Shows the Full Story
Your calendar displays more than PnL. It shows the screenshot of the trade, your entries and exits, your annotations, indicators, tools, and emotional state — a complete visual diary that automated journals can’t match.
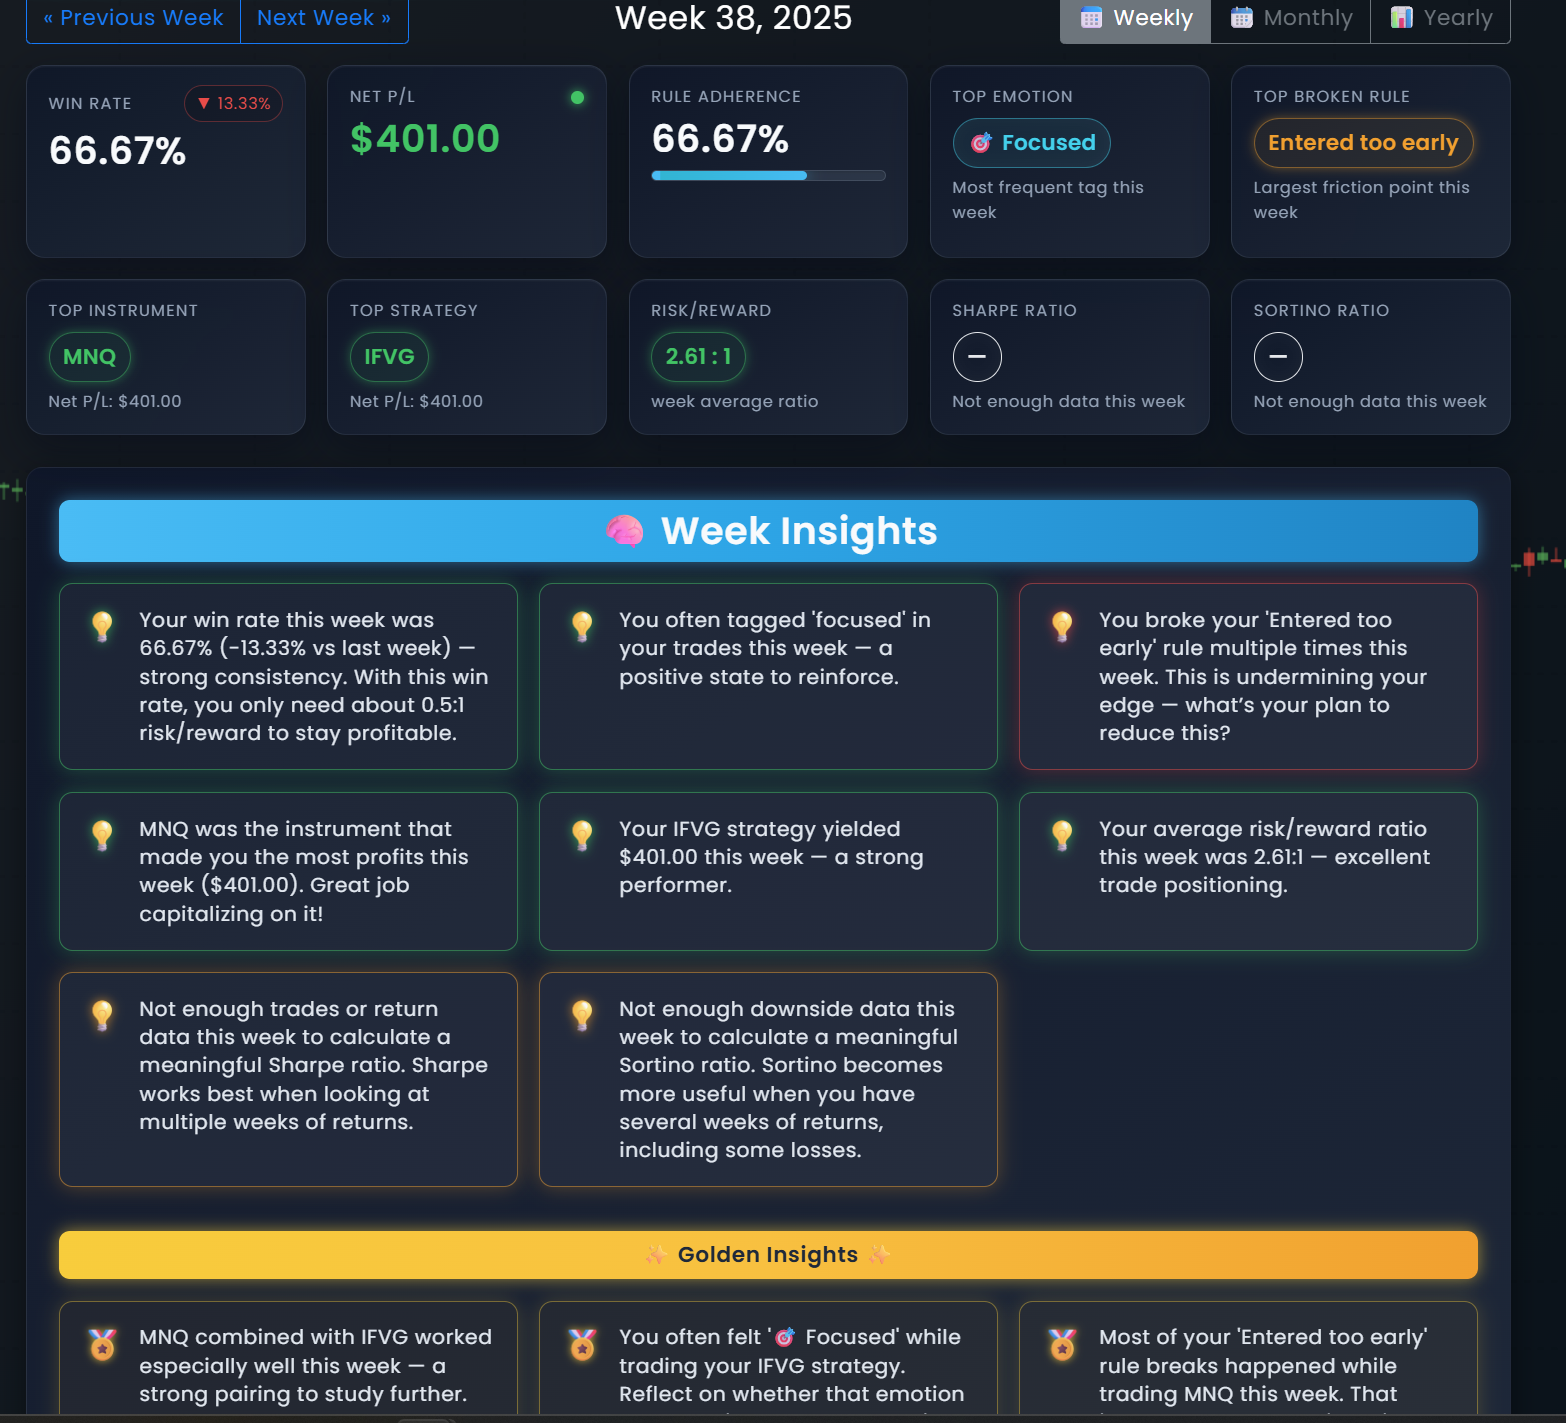
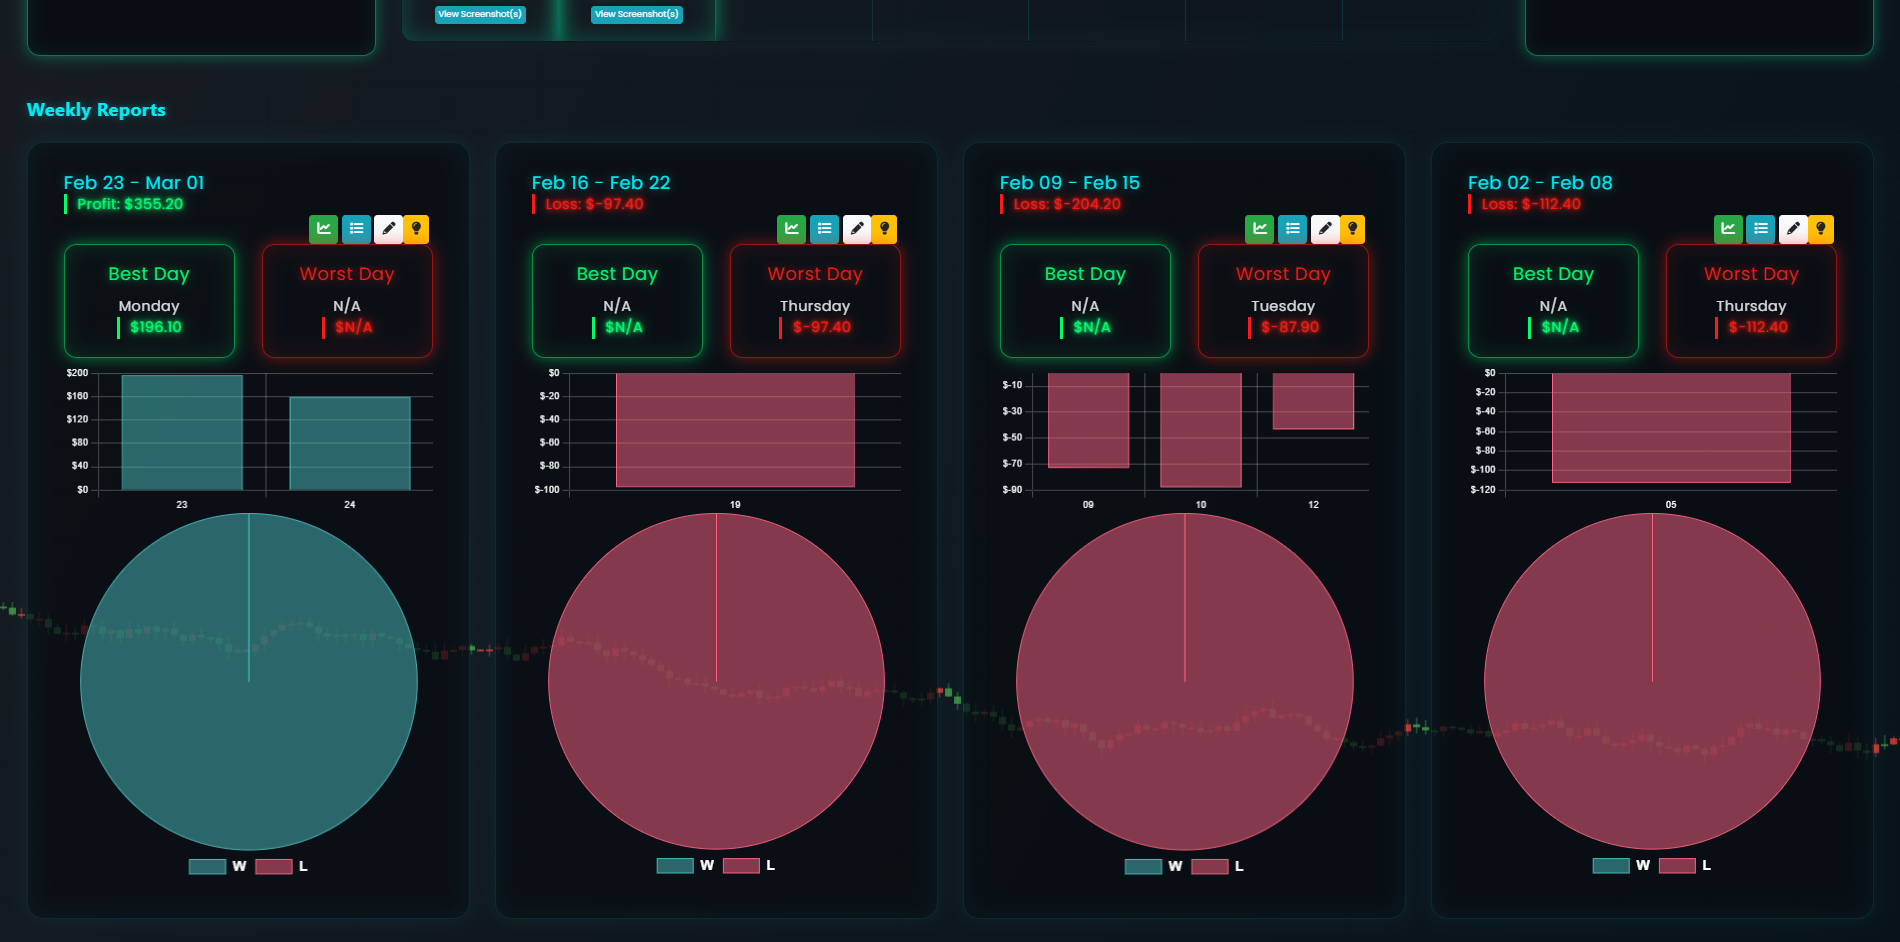
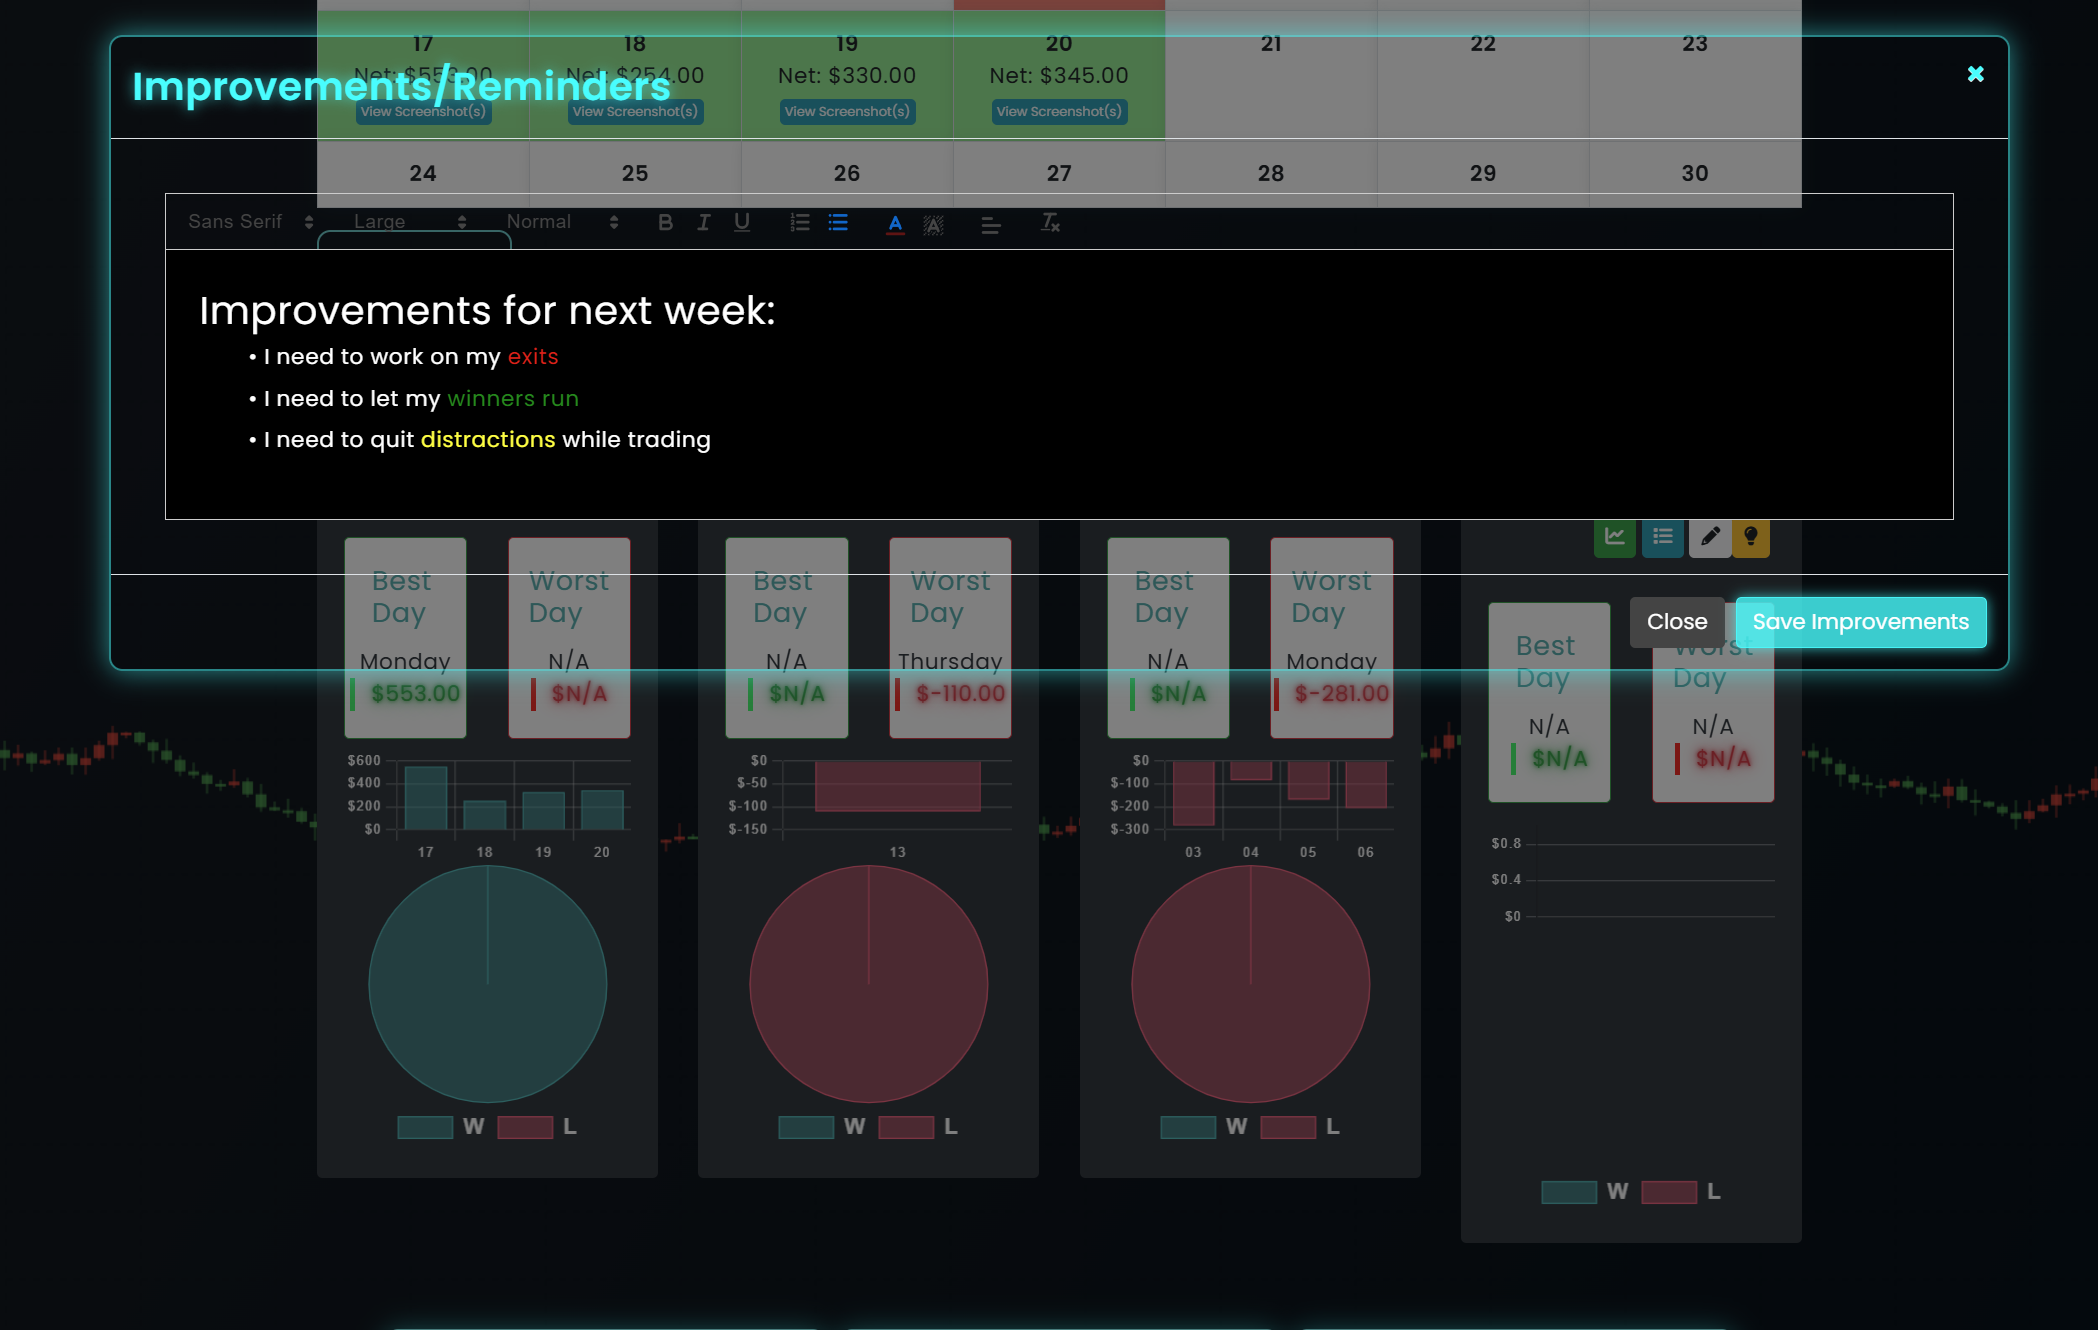
Weekly Report Cards That Keep You Honest
Every week, Wick‑Out generates a full breakdown: win rate, best and worst day, daily PnL, weekly trades, pre/post market notes, reflections, and improvement reminders that pop up next time you log in.
Are you tired of blowing up accounts?
Try the Wick‑Out Discipline Cycle
 1
1
 2
3
4
2
3
4
 5
5
 6
6
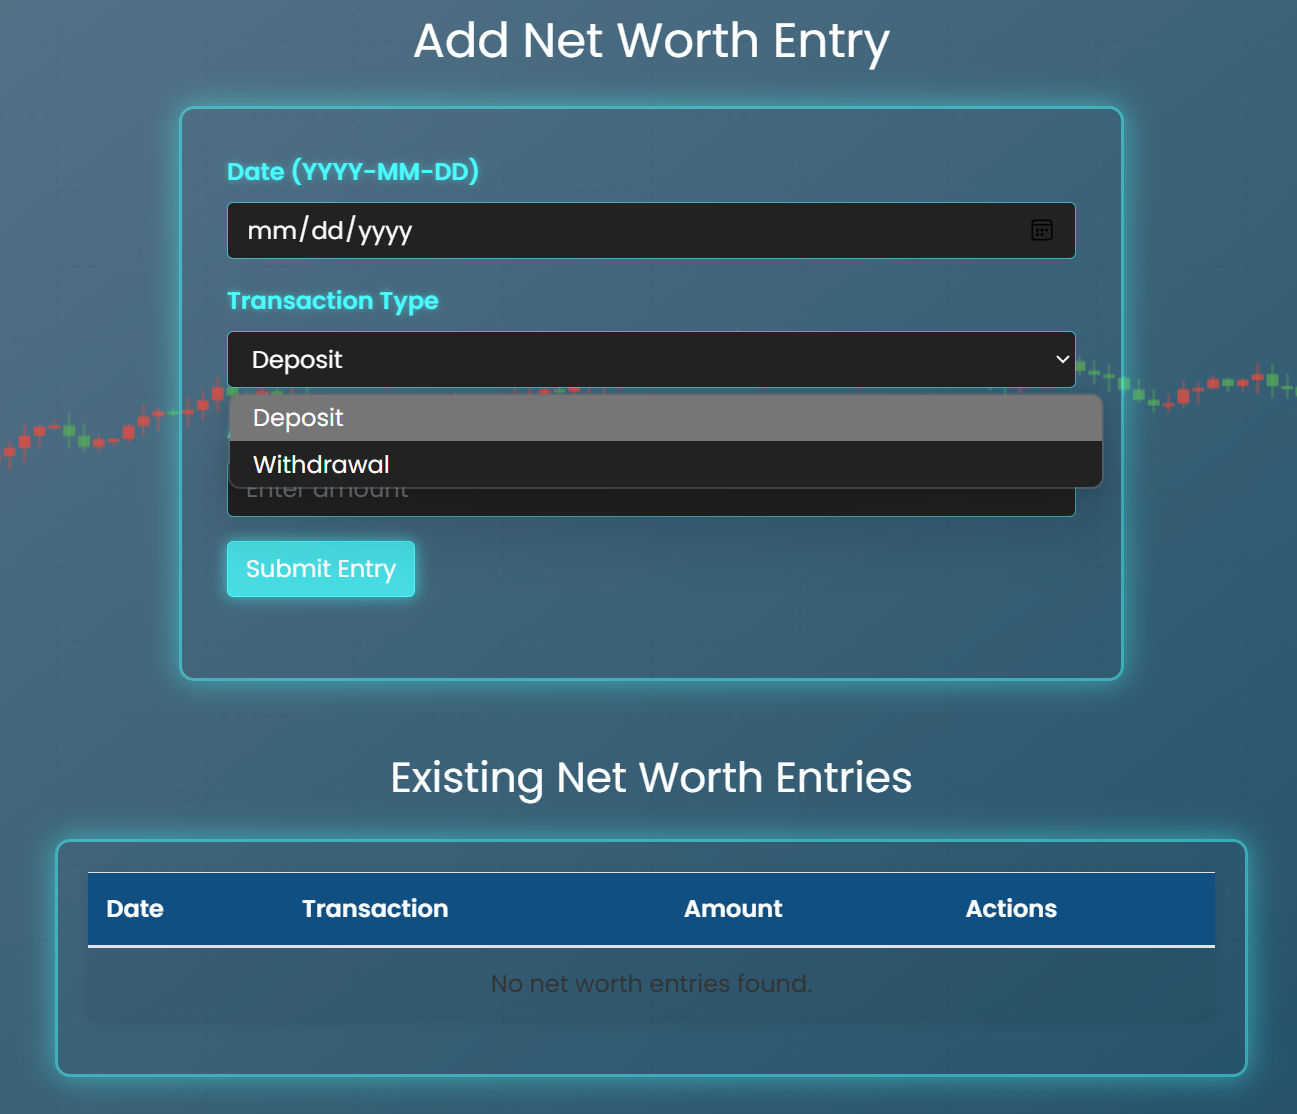
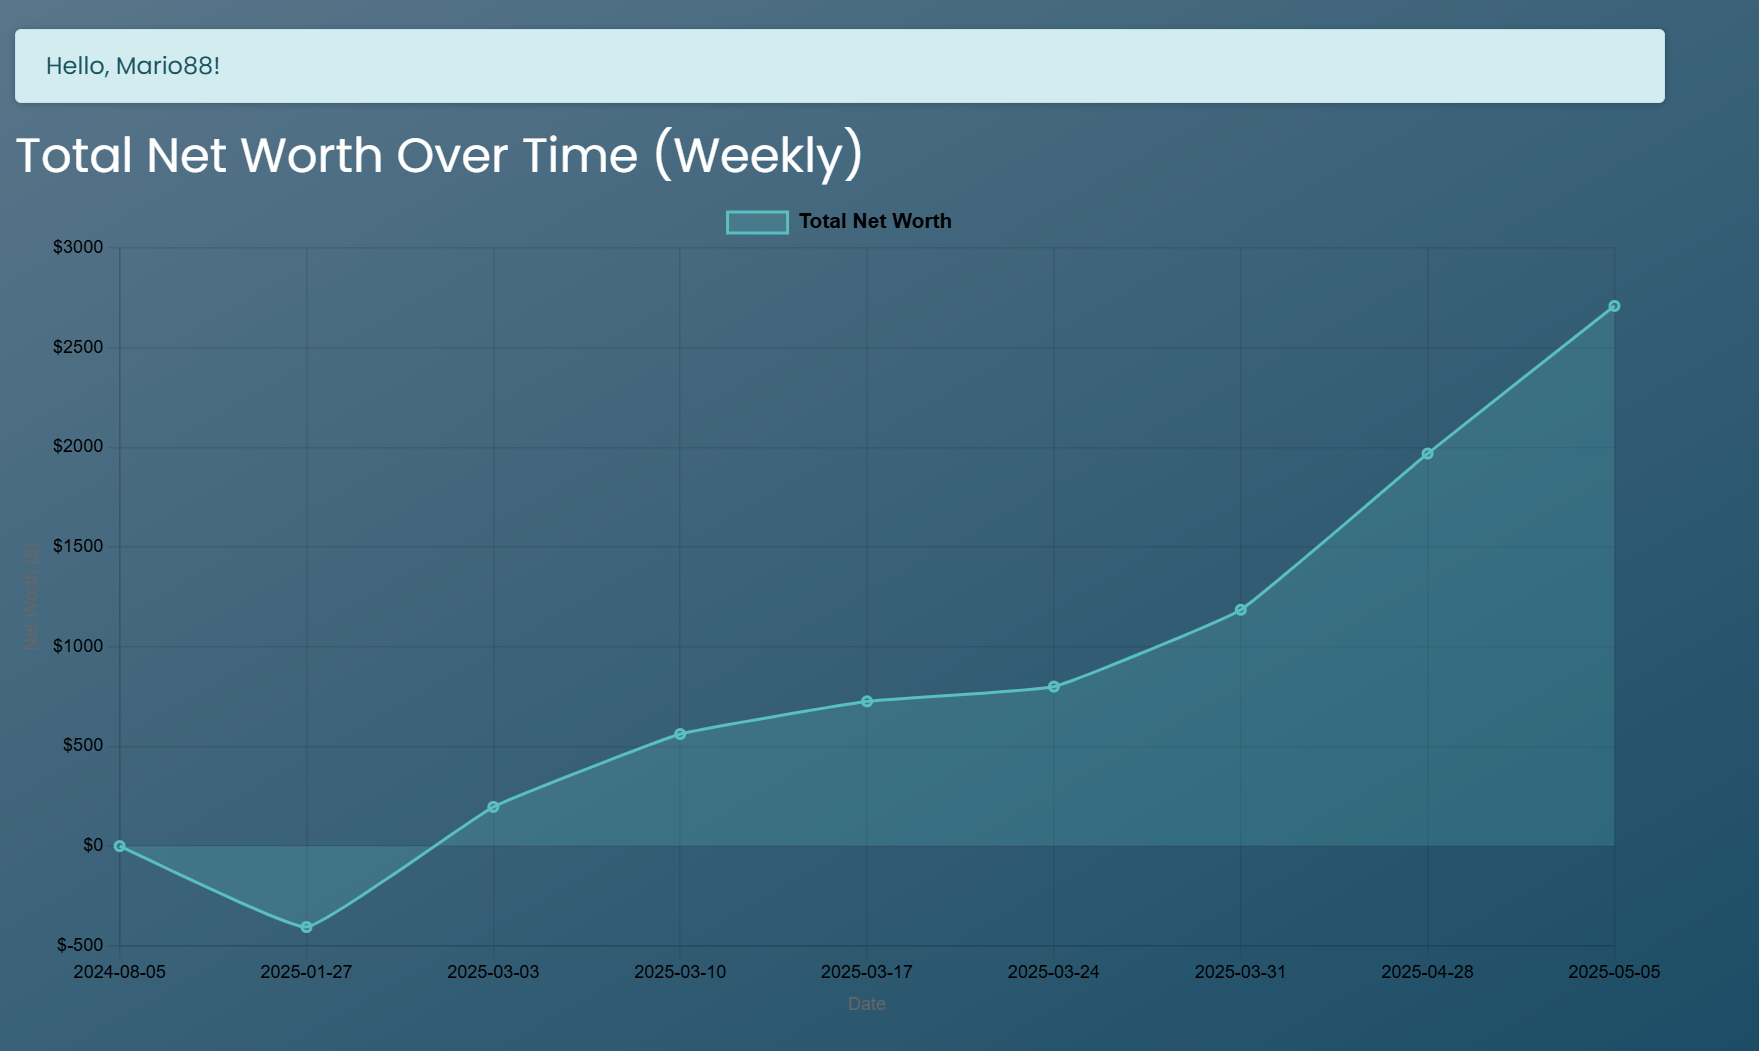
Net Worth Tracking
Add or withdraw net worth entries, track weekly performance, and visualize your long‑term growth with clarity.
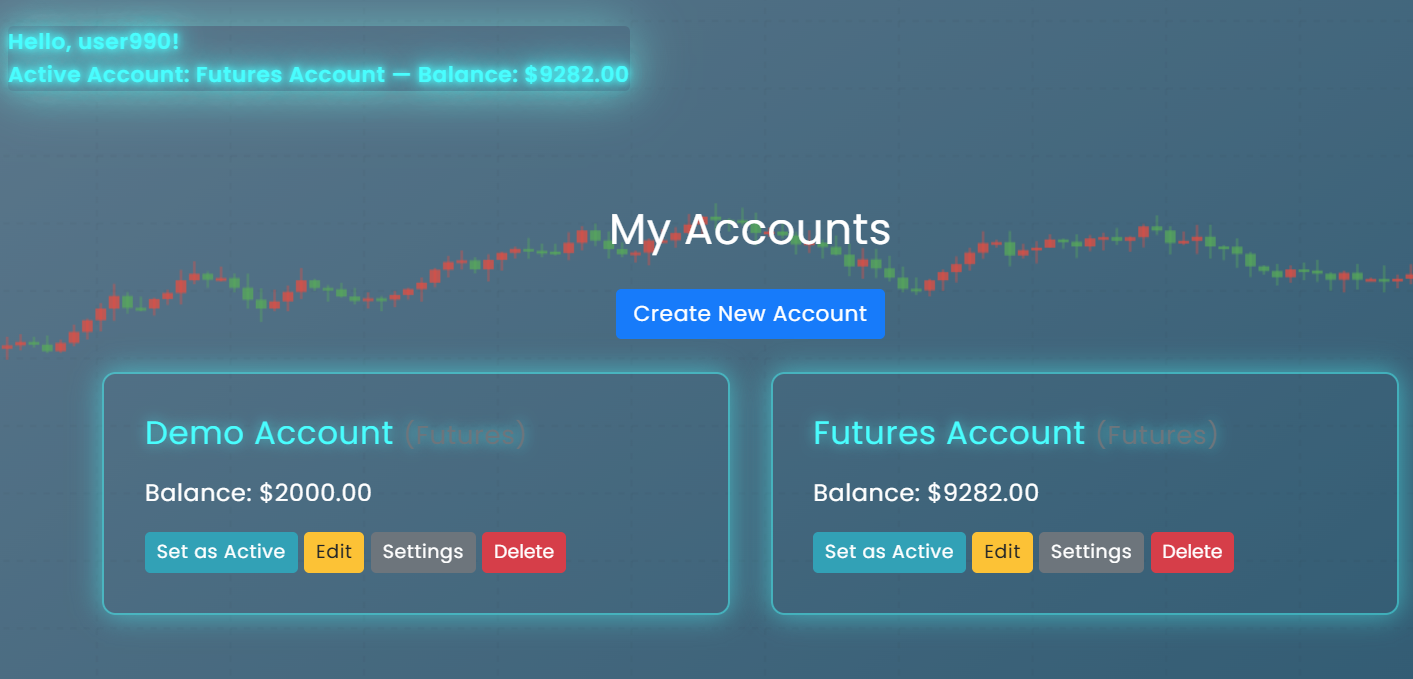
Manage Multiple Accounts Effortlessly
Add as many trading accounts as you need — all under one subscription, one price, no hidden fees.
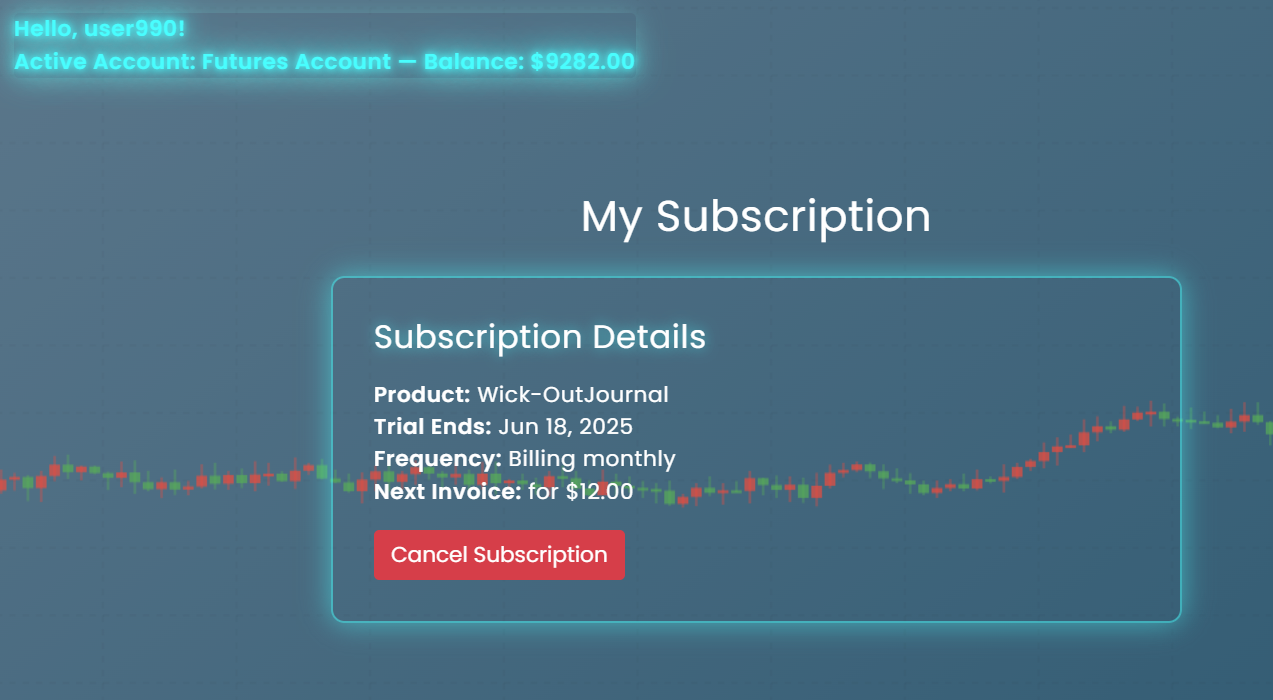
Cancel Anytime, Zero Hassle
No tricks, no fine print. You can cancel instantly from your dashboard whenever you want.
What Traders Are Saying
Free Tier
Core tools to build discipline — forever free
- Manual trade logging
- Dashboard access
- Performance metrics
- Mini‑Charts Suite
- Weekly reports
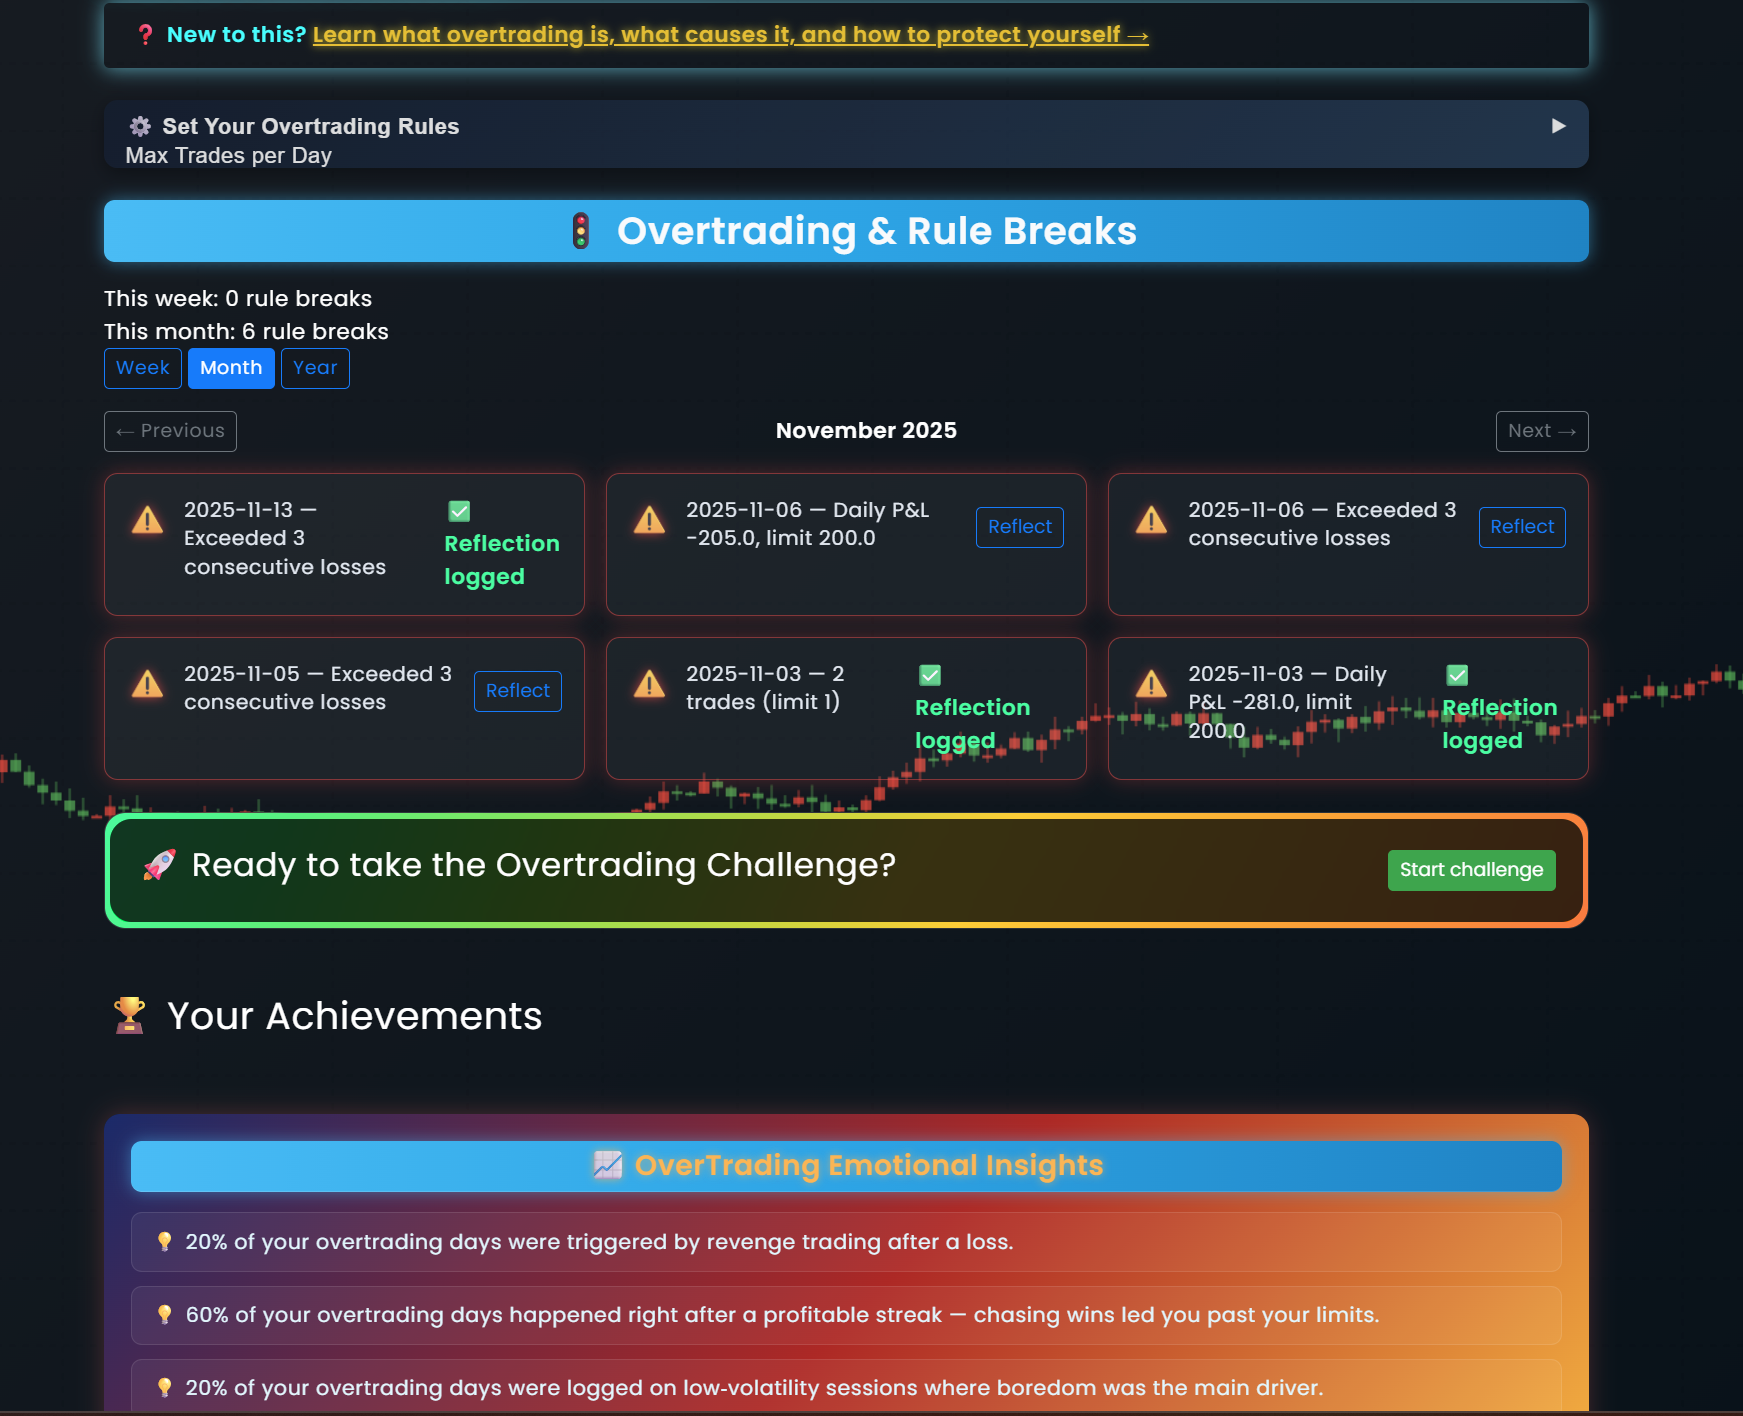
- Overtrading insights Trader Favorite
- One account
Show full feature list
- Expectancy
- Average Win / Loss
- Win Rate
- Trades Table
- ROI
- All Mini‑Charts
- Calendar View
- Full Analytics Suite
- Psychology Insights
- Multi‑Account Support
- Emotion Tracking
- Loss Management
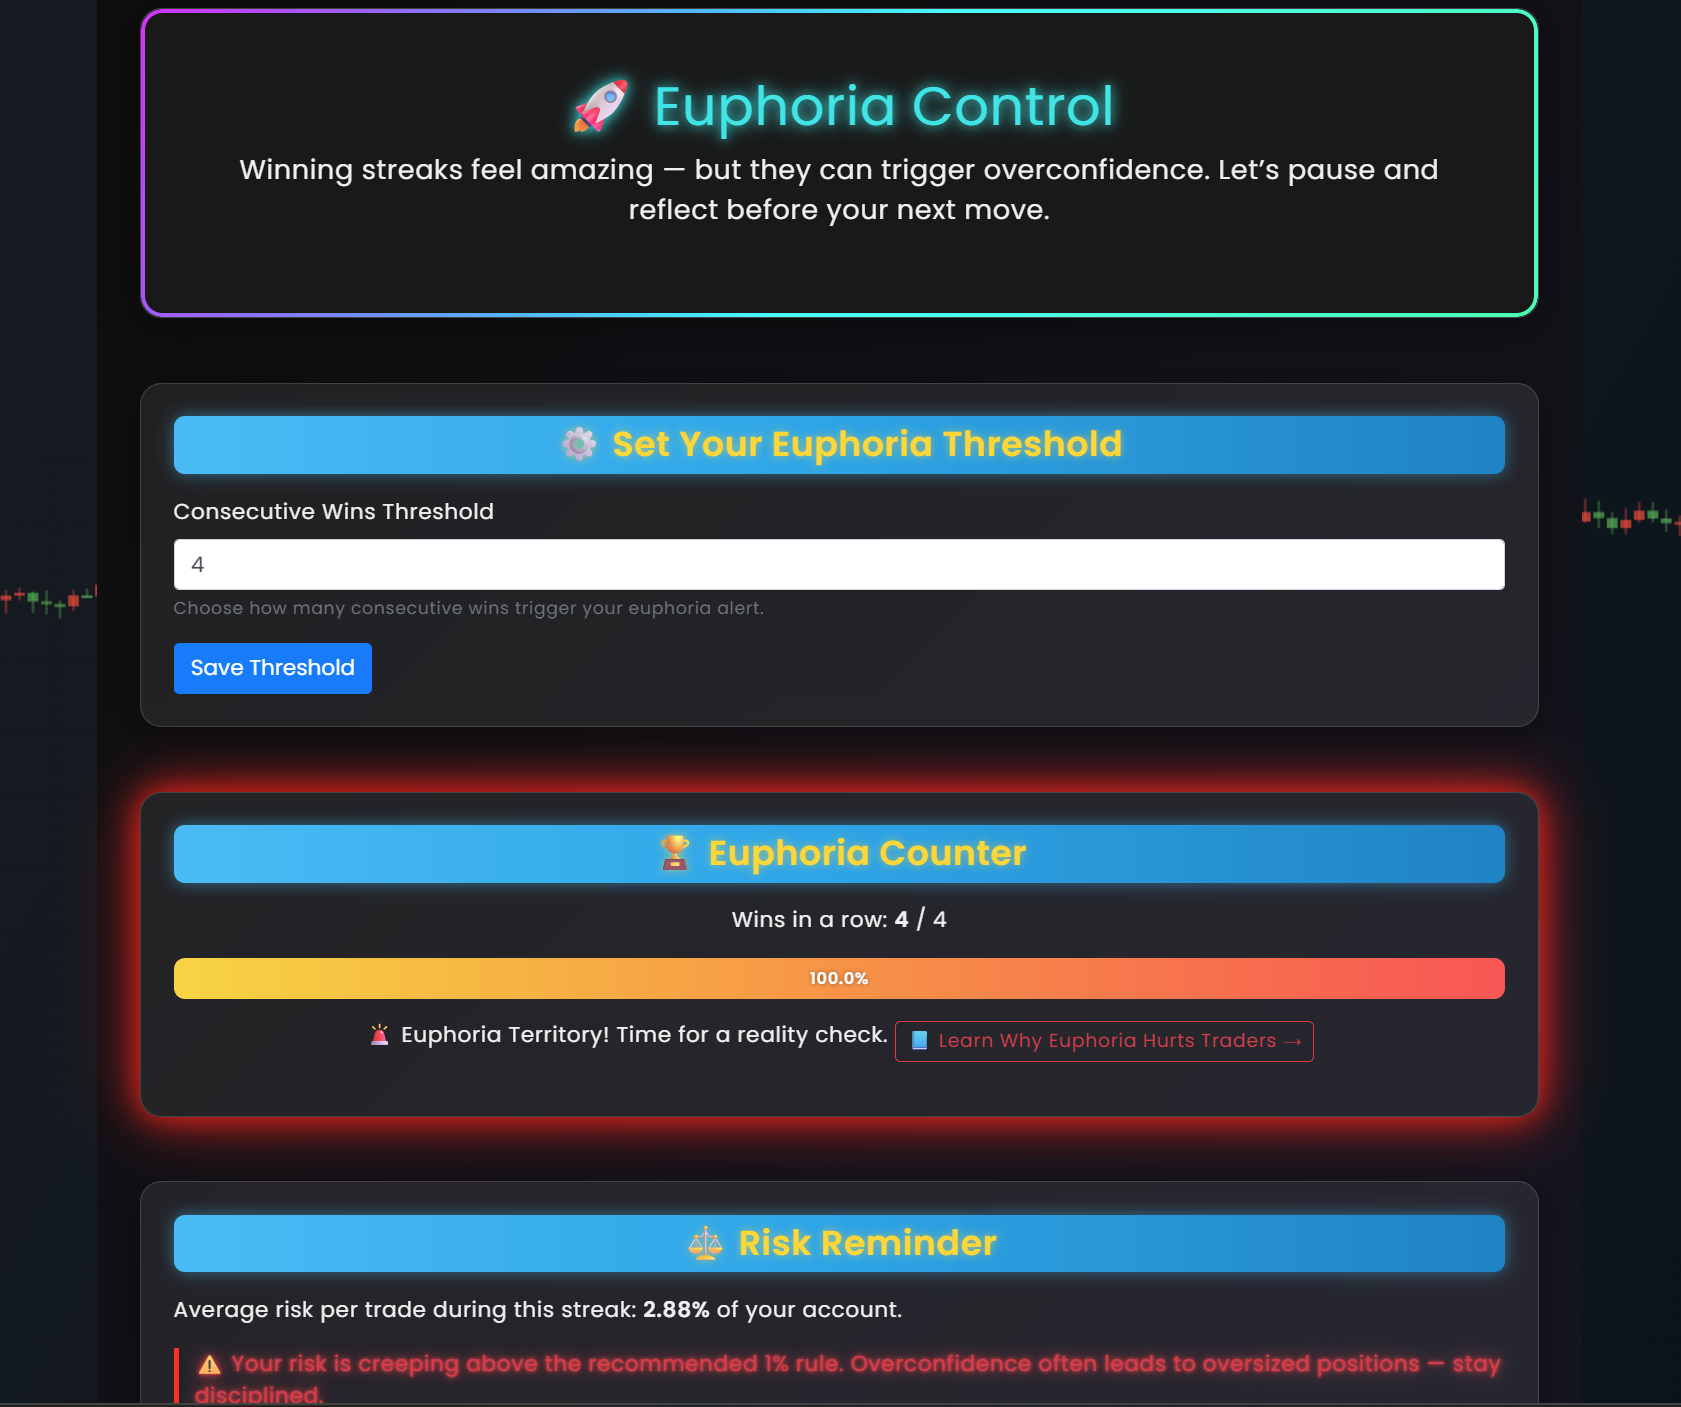
- Euphoria Control
Pro Plan
Advanced analytics, psychology tools & multi‑account support
- Everything in Free
- Calendar View
- Full Analytics Suite
- Psychology Insights Trader Favorite
- Overtrading insights Trader Favorite
- Multi‑Account Support
- Loss & Euphoria ManagementTrader Favorite
Show full feature list
- Yearly Analytics Graph
- Monthly Analytics Graph
- Win/Loss Pie Chart
- Performance Analytics
- Networth Graphs
- Instruments Graph
- Trade Duration Graph
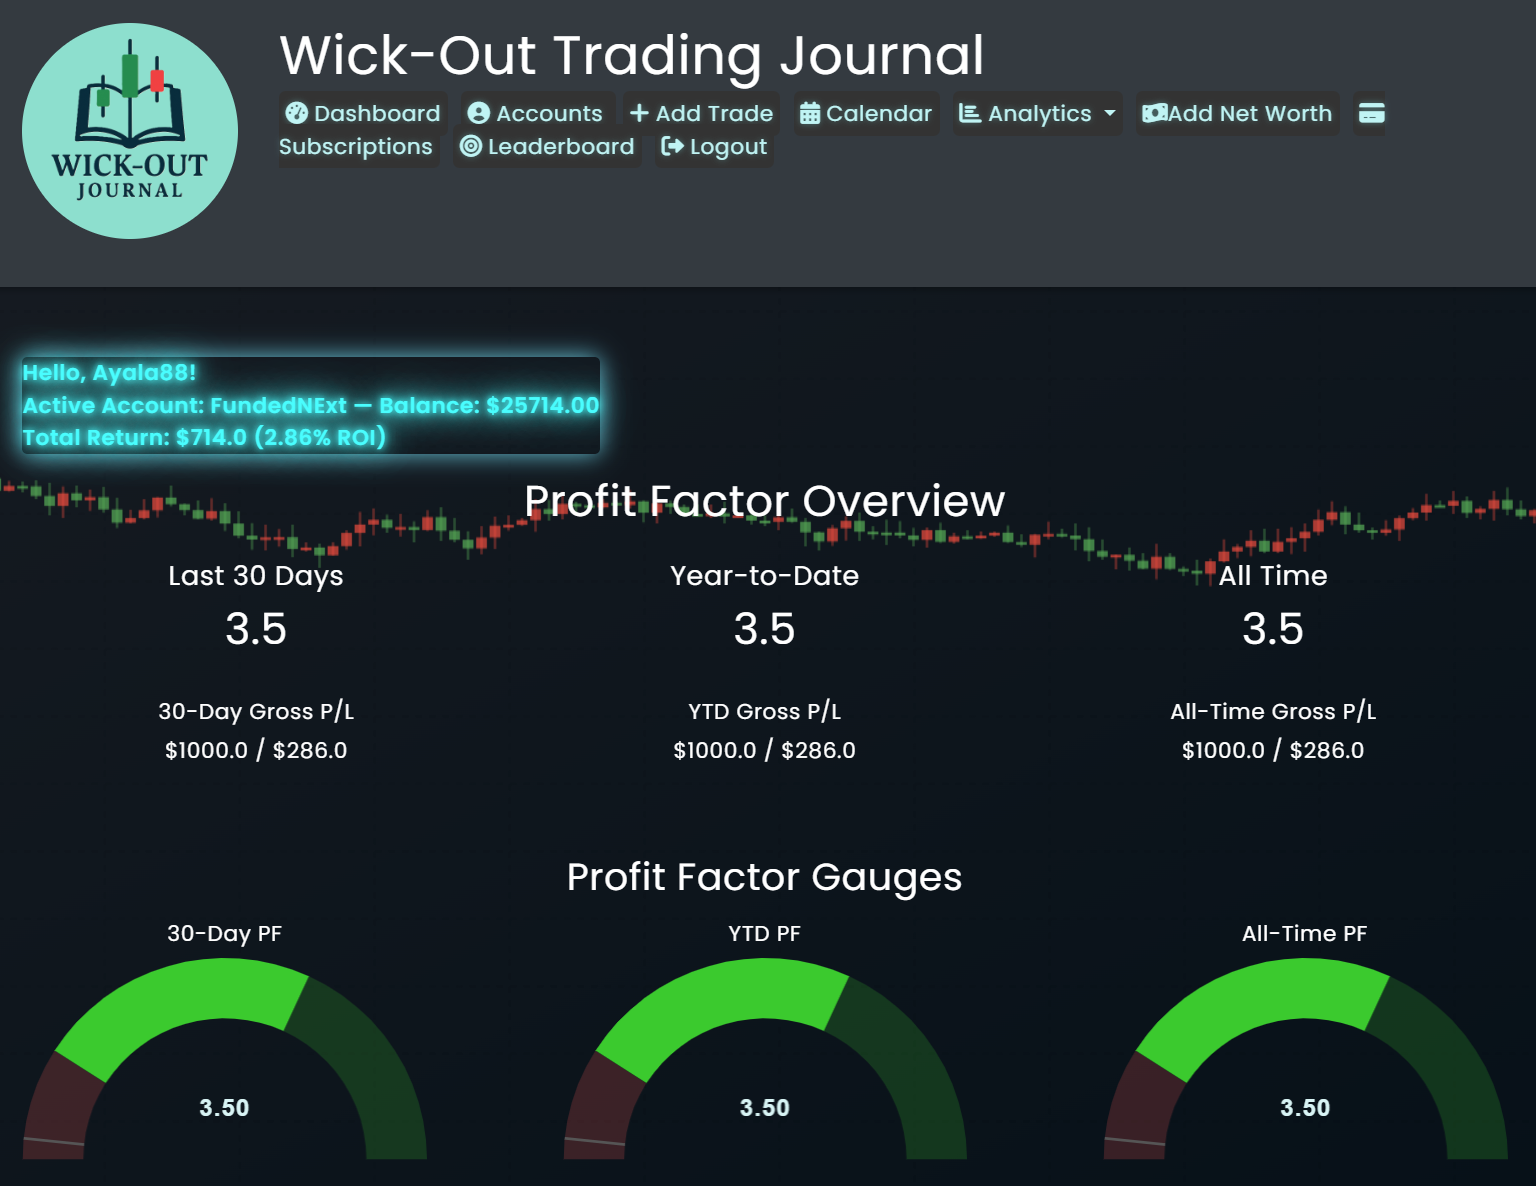
- Profit Factor Graph
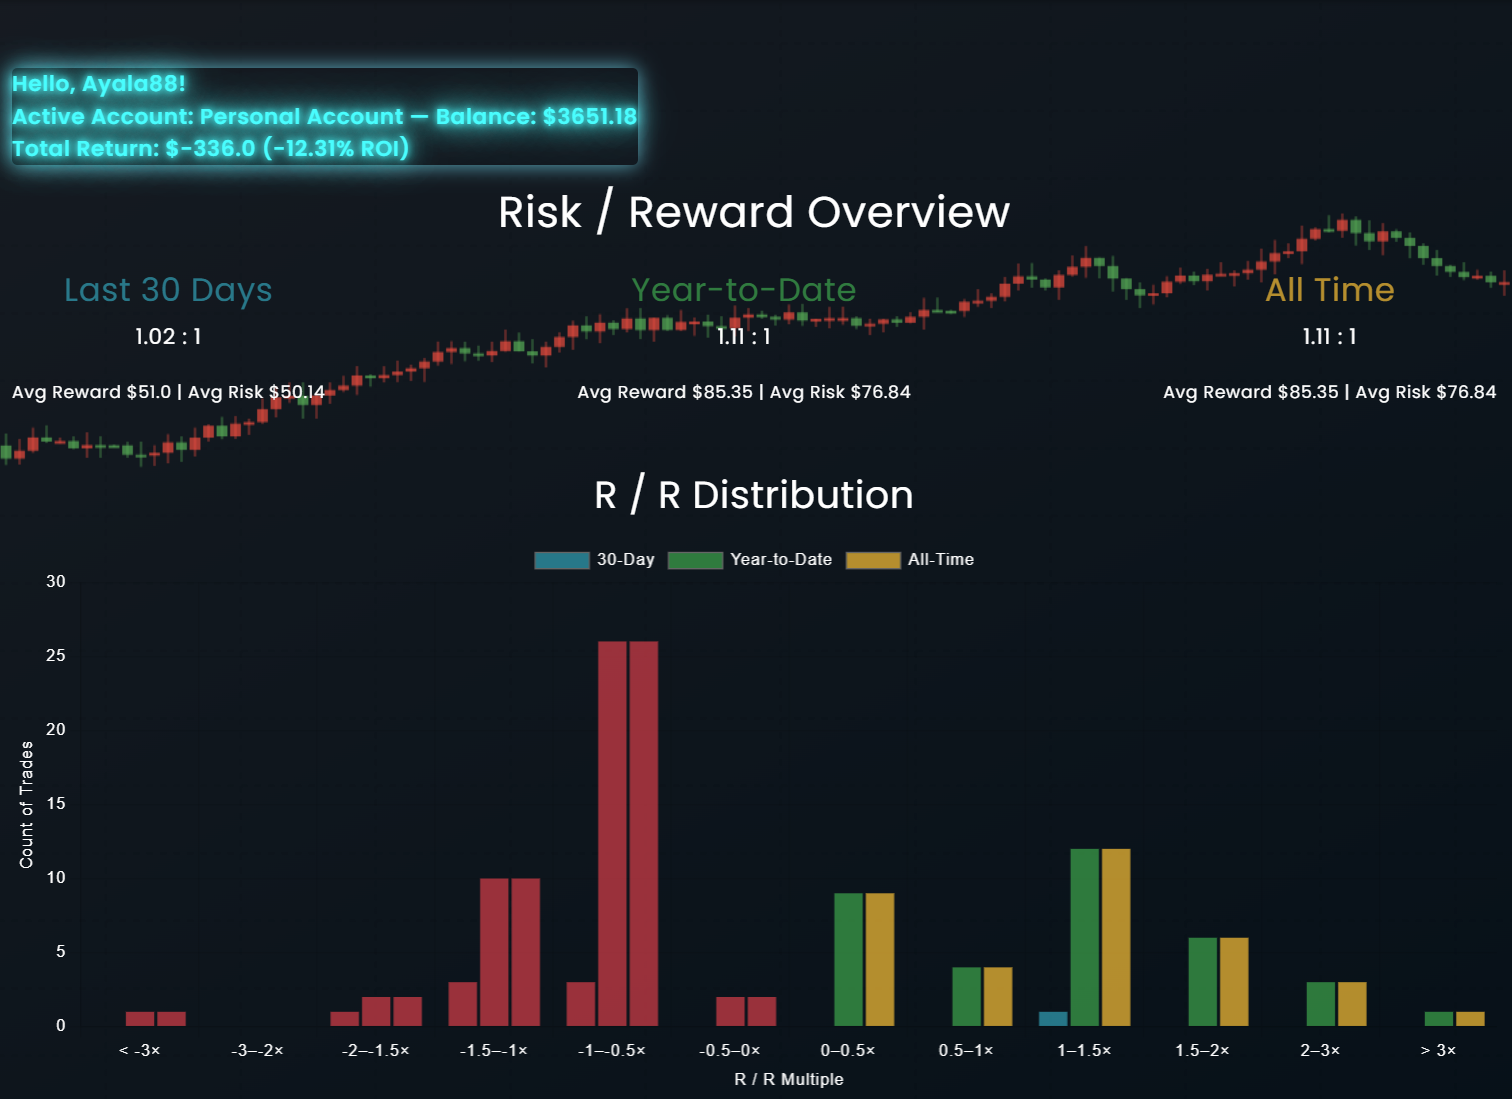
- Risk Reward Graph
- Strategy Performance Graph
- Max Drawdown / Recovery
- Sharpe / Sortino Ratios
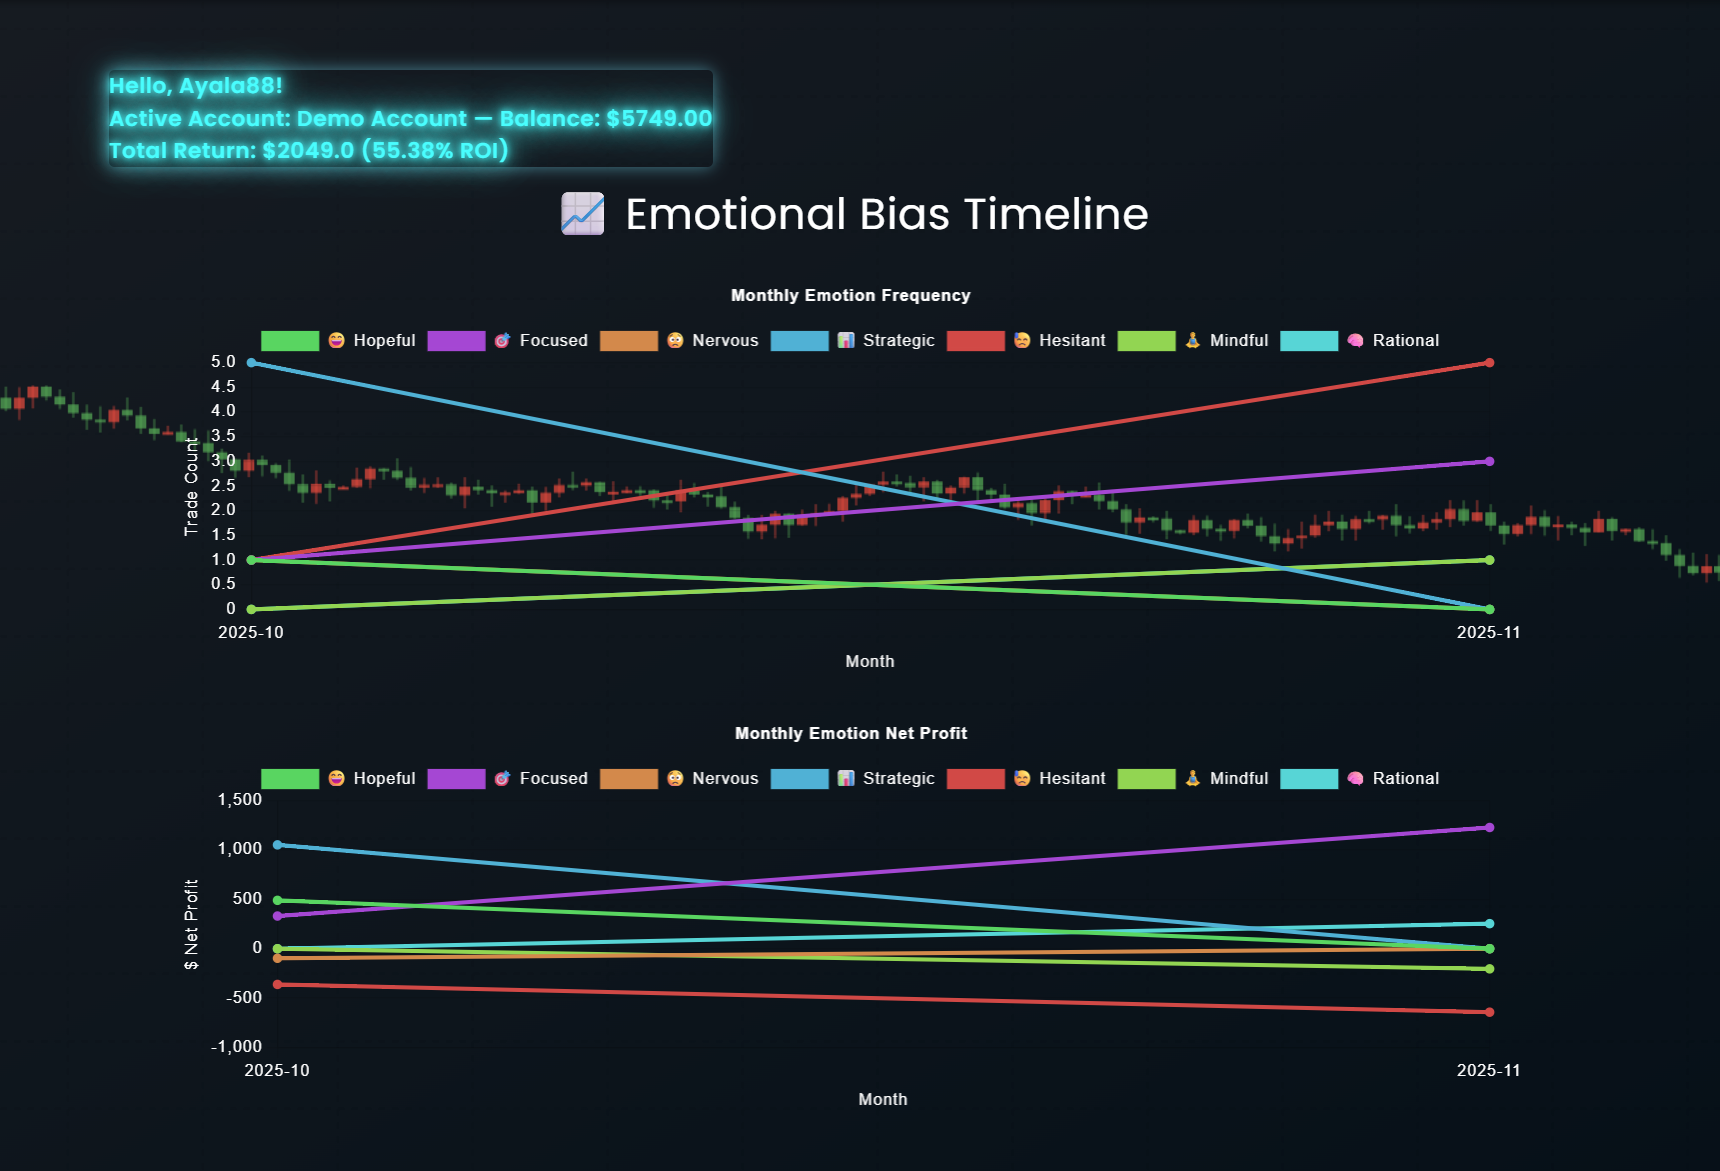
- P&L by Time of Day
- Emotion Timeline
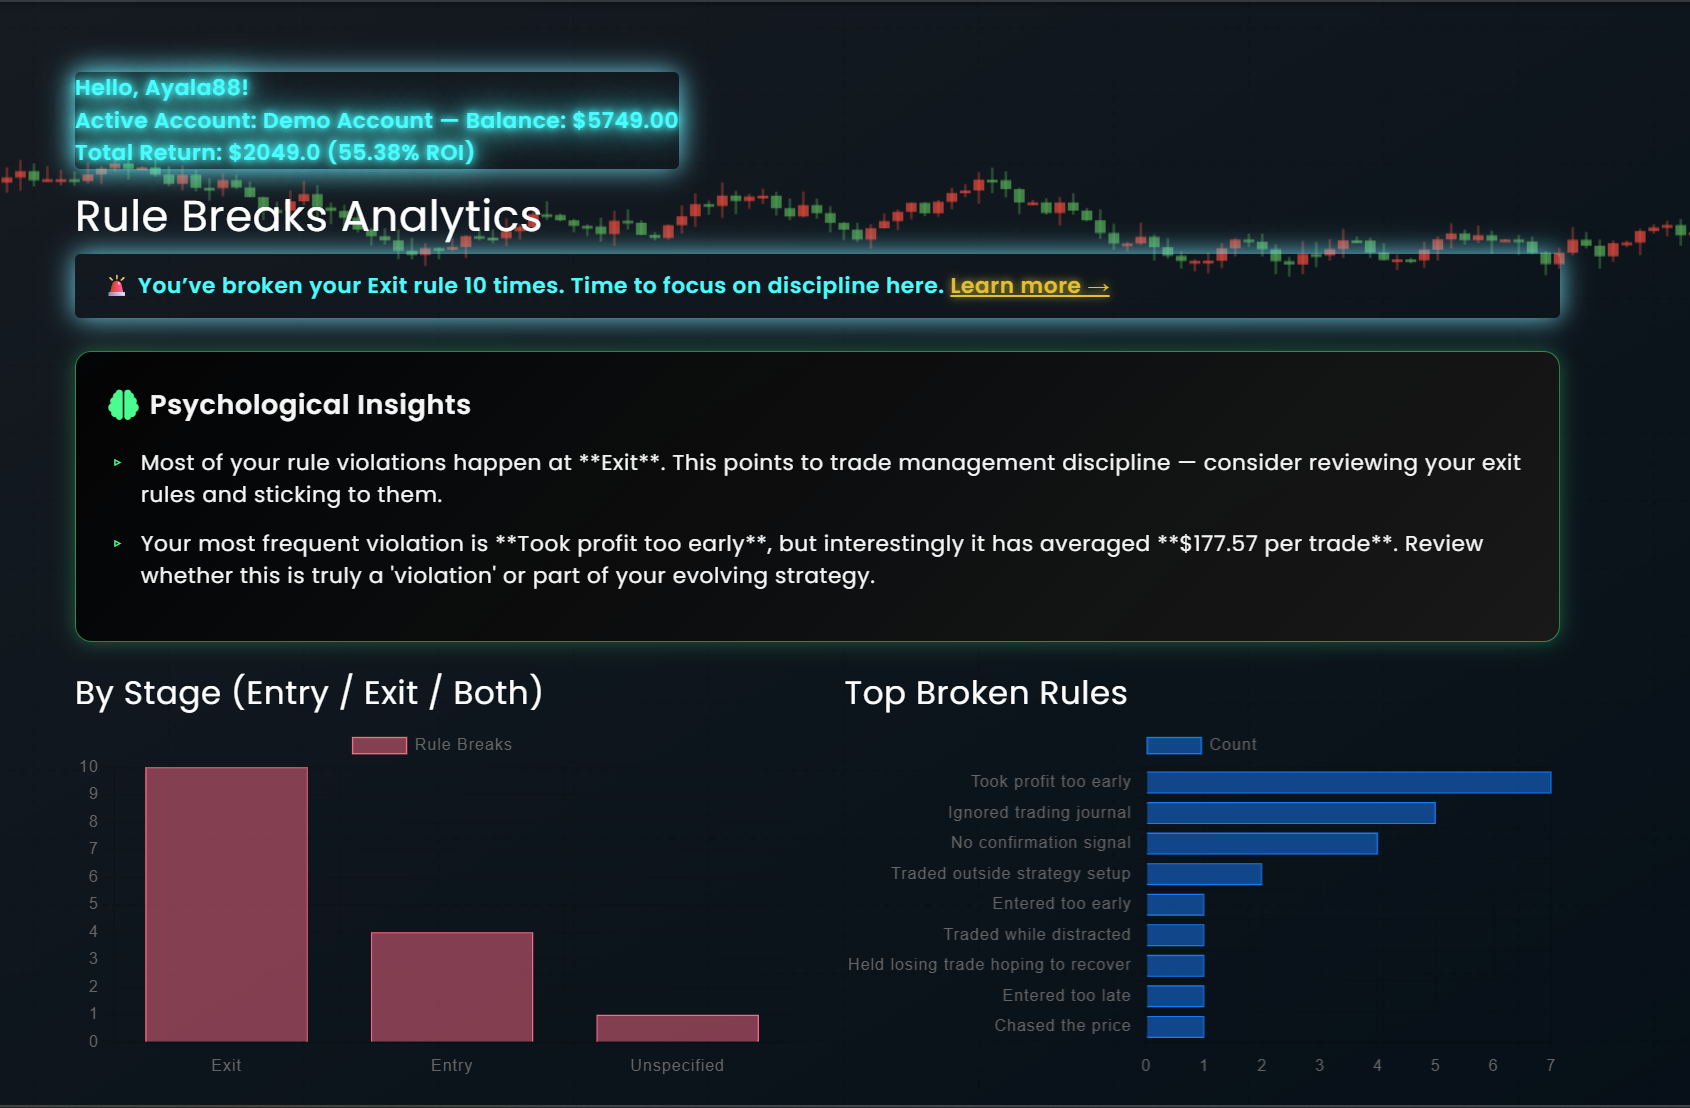
- Rule Breaks Trader Favorite
- Emotion Tracking